GASBTCGASBTC
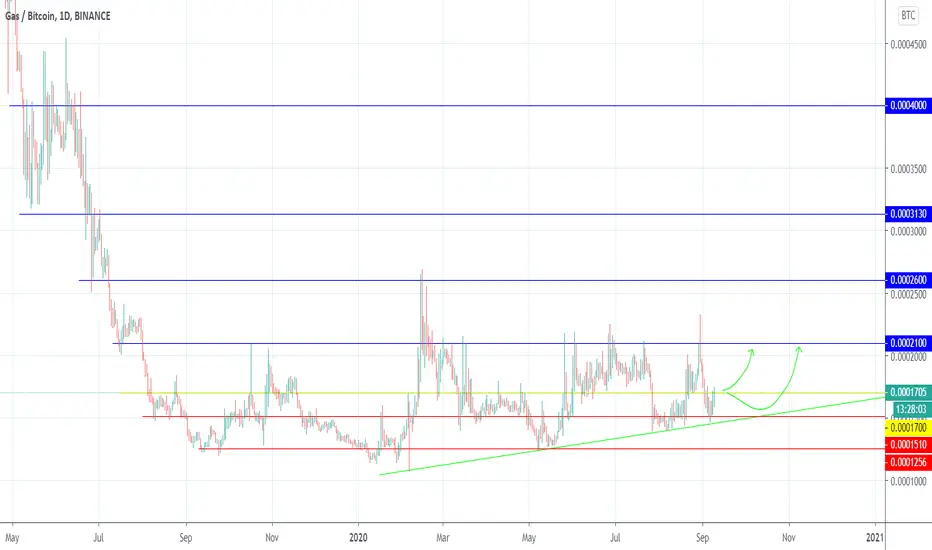
Purchase in the area of 0.00017 - 0.000151
1 - 0.000210
2 - 0.000260
3 - 0.000313
4 - 0.000400
Fixation below the green trend line, the price may turn into accumulation
f you like what I do, put 👍 and subscribe
Waiting for your comment, what do you think about this?
GASBTC
GAS/BTC - a map for the futureGAS/BTC - a map for the future
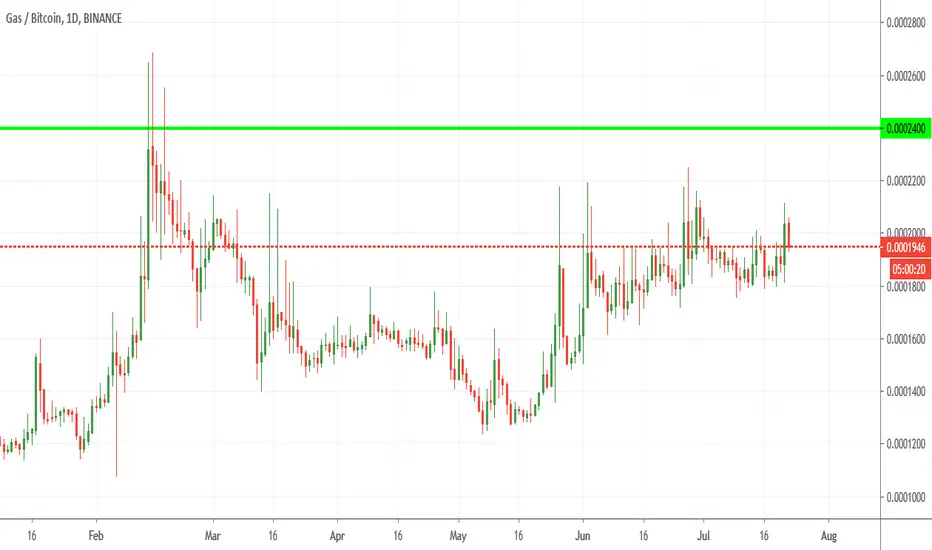
Gas retraced more than 98% against BTC, which is quite a lot, and started what seems an accumulation phase after 11th September 2019
The green line will be a strong support, and the first RED line will be a possible Target at 2777.
If it will b able to close a weekly candle above it, the other long term goals could be 4440.
Lastly, if it would be able to close a weekly candle above 4440, it could aim to 6111
As you can see 4440 and 6111 are less colored because are less probable.
The Pink dates could be a moment where the price tend to bounce up or slow any eventual fall.
In the short term, it is possible that the price could be rejected by the red eye.
LS MASTER TRADING SYSTEM

GASBTC | Accumulation about to breakGASBTC is attempting a breakout.
If broken out next resistance is 120% away.
Dont miss this one


GAS LONGGAS is usually following NEO , which is also starting new cycle. + GAS is in oversold area, I expect bull run very soon. GL !
btw this is not financial advice :)

GAS Is ON Now $$$Hi Guys !!!
Bit of a Price correction soon coming up, which could possibly stop at $1.78-$1.82...but GAS is Going to make a huge move...next stop with this bullish trend it would be $2.2 and then 3.8 soon after....Finally, Gas is ON Now after 2 and half years !
Cheers !!! Happy Trading !!!


GAS/BTC is in a very large bullish triangle!GAS/BTC is in a very large bullish triangle!
Enter in the green zone for an aggressive entry before the breakout.
BTC needs to behave so alt/btc pairs don't get rekt.
This chart could change dramatically and become invalid if Bitcoin behaves irrationally.
Depending upon your risk tolerance, set stop below any one of the support lines.
Trade safe my friends....
BINANCE:GASBTC


GAS Breakout SetupBuy : 1900 - 1920
Stop : 1800
Target : 2100 , 2500 , 300 , 3500
price at trend line Support price close below trend line support is our stop loss but for fake breakdown we will set 5% stop 1800
price at trend line support and also right shoulder about to complete

GAS coin perfect Buying SetupNeed daily close above 1800 and we are ready to go
S/R flip really close 2000 sats close above 3000 is just walk by
Holding 200 EMA with kumo cloud support on daily perfectly
waiting for tomorrow close

Triangle | Support | Bull Channel | 12% GRSPrice action is moving in a Broad Bull Channel. We aim to finish the Bear Leg and trade the start of the bull leg. Breakout mode is in we await the Breakout momentum to see any reversal or say, start of Bull Leg
Disclaimer
Trade at your own risk. This is not a financial advise. We are not registered/licensed organisation for Financial Services.


Gas Going As Chartted, Where's The Next Target? 320%+Just a few days ago we shared a chart for GASBTC with a 100% bullish bias... This is how things are going now, the next target is marked on the chart at 325%.
This is not financial advice.
Namaste.
------
Previous analysis
Neo Gas Weekly Chart Analysis With 385%+


GASBTC chance for good profit. $gasOur indicators are referring to buy GASBTC .
please note that we could get short signals so you need to follow with our indicators to see when you have to close the order.


Neo Gas Weekly Chart Analysis With 385%+About Gas
Gas is a token created on the NEO blockchain platform with the primary purpose of being fees for processing transactions on the NEO network.
Source: coinmarketcap.com
Website: neo.org
-----------
GASBTC Weekly (W) by Alan Masters
Here we have prices breaking above EMA10 for the first time early February.
After the Feb. low, we are now looking at a higher low.
Classic retrace and falling wedge visible.
Bullish indicators.
This will be another winner by looking at the chart.
Make sure to have a plan/strategy before you trade.
Namaste.
