LONG UGA @ $28.50 for Gasoline Futures bounce from $1.64Gasoline Futures (RBOB Gasoline Futures) likely counter trend bounce here off 200weekSMA support at $1.66 to reclaim long-term moving average support of 50monthSMA at $1.70, then rally to test 100weekSMA resistance at $1.80.
Technical Analysis:
- Gasoline Futures (RBOB Gasoline Futures) now testing long-term support of 200weekSMA at $1.66.
- $1.66 also strong price support from Feb 2018 for potential double bottom pattern
- Daily & Weekly RSI extremely oversold
- Daily MACD record lows
- 50monthSMA long-term support sitting at $1.70 to continue uptrend from 2016 lows
- Potential bottom hammer candle on hourly chart today at $1.66
Fundamental Analysis:
Over recent weeks, we have seen an almost perfect bearish storm in the Crude Oil market that sent the price of futures from a high of $76 to low of $61, a decline of about 19% in less than one month. Rising production, increasing inventories, a strong dollar, concerns over trade, and the realization that the sanctions on Iran include some exceptions, all led the price of the energy commodity lower in a dramatic corrective move. These factors have had a greater impact on its bi-product Gasoline, which is also undergoing a seasonal bearish period during the winter months. However, we feel this move has been overextended to the downside as there are still 3 fundamental reasons why oil is close to low and could spark a counter trend rally in Gasoline.
- Turmoil in the Middle East could result in a decrease in production and rapid price increase
- OPEC expected to cut production at their bi-annual meeting Dec. 6th
- Pullback of USD from highs due to US election results could relieve some of the bearish weight on commodity prices
- Demand for the energy commodity remains strong with increasing population and rising heating oil cracks
Gasoline


Gasoline forecast until end of year (RBOB)Looks like the price will remain in this channel until the end of the year, look out for confirmation of the long movement, then short when you get confirmation of the movement down from the top.
Hit like if you agree.
Follow for more forecasts like this.
PETR4: Seeing monday by my crystal ball.My Cristal Ball say for monday: The active opens, it goes up, it goes to average, falls under the previous minimum, and go to the Gap below.

1D Rectangle. Neutral trade. Scalping.Gasoline is trading sideways within a 1.9950 - 2.1890 Rectangle on 1D. The neutral 1W RSI = 47.963, ADX = 14.795 but most importantly its High Volatility (ATR = 0.1150) should keep the sideways trade intact. We are long, TP = 2.1295.

RDOB Gasoline showing an upward trend with LONG SIGNALSame strategy as the related ideas below.
Currently reading a long signal. Is that because Winter is approaching in the northern side of the sphere?
Strategy
Refer to BTCUSD and TRNUSDT related ideas below for detail into strategy, which works well with only high volume/volatile coins.
Summary: All indicators must cross to give a strong buy/sell signal
i.e. fibonacci lines, bollinger bands , macd , rsi must be crossed simultaneously.
PNL = +13.8%
Max Drawdown = 0.2% !!!
2 closed trades in total spanning ~4+ months (over 3% profit a month)
p.S. its a shame the graph above doesn't allow you to scroll back to view the whole range of time :(, but you can still view all the trades below

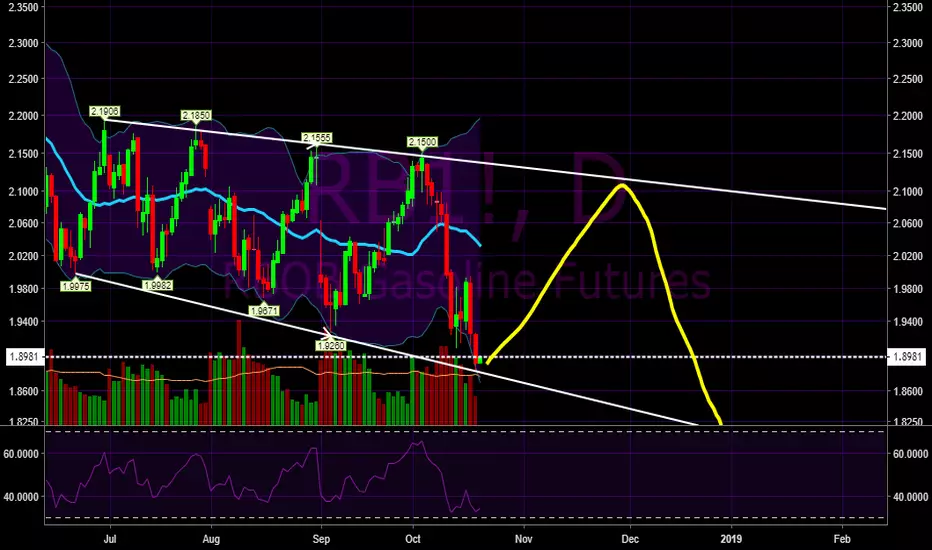
NG1! - NatGas potential to turn.The white fork gives us the most probable path of price on a longterm scale, it's up.
The yellow fork is the opposite force, and projects the potential for a pullback from the very top, with the target at the centerline.
The price drop through the yellow centerline lead in a halt right before the L-MLH (Lower-Medianline-Parallel) of the yellow Fork.
This halt, or "not reaching the L-MLH) is called a HAGOPIAN in the Forkers term. It gives us a heads up that price will move in the opposite direction more then from where price came (...from the yellow centerline).
In short:
- Price has reached a high probability area where it has the tendency to turn the current trend.
- Confluence of two Fork-Lines indicate the same.
- The uncleared HGPN at the yellow L-MLH tells the same.
- The red pressing line looks scary, but is probably just a fake.
- A "Flush" of the longs below the yellow Centerline, and then a sharp climb up above again would not be surprising.
P!

NEO VS GAS VS Shanghai Composite SHCOMP: 6 month head to headAll explained on the graph.
My predicted outcome
GOLD: GAS
SILVER: NEO
BRONZE: SHCOMP
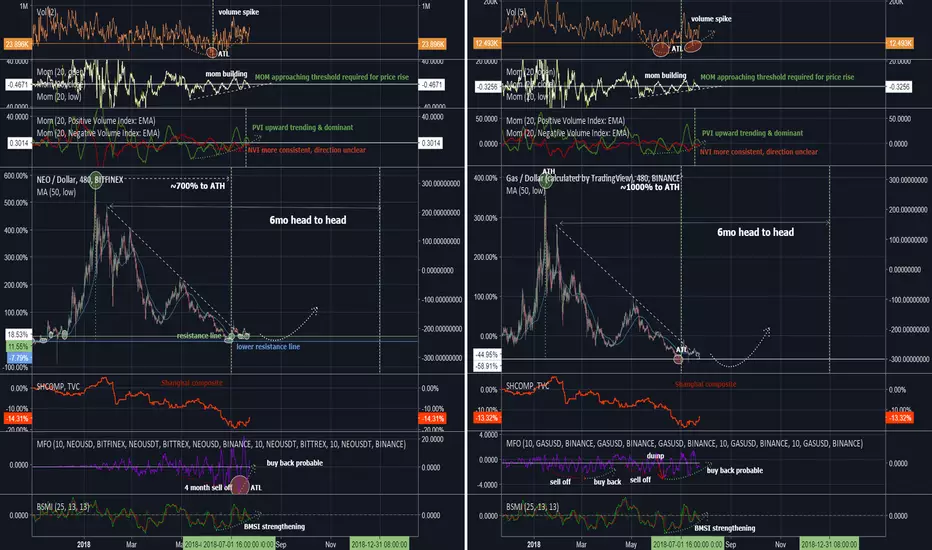
GASUSD VS NEOUSD 6 month head to head. 1000% ROI #teamgsasThe chances are you’ve heard about NEO, often dubbed the Chinese Ethereum. Like its predecessor NEO is designed to act as a smart contract platform and has aim of trying to create the smart economy. Unlike Ethereum, NEO is actually comprised of two separate tokens, NEO and neoGAS (GAS).
Both are fantastic long term investments but which is the better 6 month performer?
I believe that the demand for GAS will outstrip the "mined" supply at least in the short/medium term (6 months) and am quietly confident that within this time frame GAS will exceed its all time high, resulting in a return on investment of +1000% from today's price.
#teamgas

Gasoline is moving strong for more than 10 months, now what?Keep eyes on the price of Gasoline, this could trigger a stock market contraction and recession as discretionary capital is sucked into gas higher prices.
Gasiline is trending above the 50 and 200 MAs, it is signalling over bought now however.


Gasoline Entering holiday weekend and hurricane after effects, we should see a few weeks of significant draw downs in inventory.

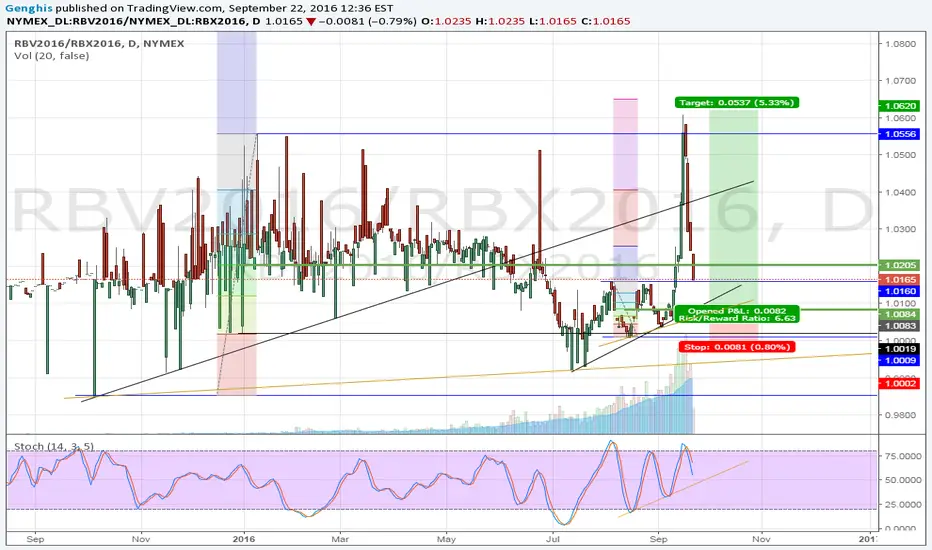
A good one could be setting upThis spread is now on the radar but waiting to see thing settle down a bit in Texas. So will be ready to act when refiners come back on line or if we push to a crazy extreme


Gasoline increased 0.01 USD/GAL or 0.36%Gasoline prices to be volatile ahead of Trump conference: McKnight
Roger McKnight, chief petroleum analyst, with En-pro International joins BNN for a closer look at gasoline prices across Canada. He says that gasoline prices will reflect Trump coming into office and news from OPEC.

Analysis of production, consumption and reserves of oil and oil On April 11, a fresh STEO report comes out, so you should wait for the updated forecast for the oil market from an official source. Conclusions on this report will be published in the blog www.cofutrading.com. But at the moment the situation is as follows: OPEC reduces production, and the US increases it. But along with the growth in production, which is accompanied by an increase in the number of drilling rigs in the US, oil consumption is also increasing. Exports are also high. Despite of inreasing us oil stocks (which is quite normal for a given time of the year), the growth rate of reserves is low, it is lower than last year and below the average for 5 years of value. That in general is bullish (at least for me). Demand for gasoline is high, demand for distillate is also high, so refineries will continue to "consume" a sufficient amount of oil, absorbing the growth of supply. Judging by CFTC COT reports, as of March 28, funds reduced their extremely bullish position. I do not attach high importance to these reports, I can only say that the long lines have been dropped, so the way for entering new long positions is open. I continue to adhere to the neutral-bullish direction in the US oil market, but before the opening of new positions I will wait for a new STEO report from the EIA.

United States Gasoline Fund Testing Rising Channel SupportUnited States Gasoline Fund Testing Rising Channel Support and downtrend resistance with FIBO levels


Hitting suppoort around 43, sideways & upCrude is hitting some support as it come close to the (blue) up-sloping trendline at around 43.
Additionally the 200 day MA is right around that area.
We are oversold in terms of Bollinger, RSI and Stochastik, with the Stochastik generating a buy signal
Should the market break, targets on the downside at 39, 35 and contract low at 26ish....
Option idea:
IMHO selling put spreads. I would avoid purchasing any upside premium of any kind

RB futures long off B3 Weeklies supportGas popped on the news that a line caught fire in the south of the US. So notice how the news event negated any sign of the B3 Weeklies study working. As price capitulated and calmed down, the levels in the study regained validity. The support has held and 1.4719 mean is the target. R:R 1.5 to 1.


Sell NG following sliding curves - bearish mid-term setupSell NG following sliding curves at 2.80 level and below.
Bullish popping looks as a result of non-commerces' short positions covering and technically as a C-section between top-down curves. Currently is under control below 2.88 level .
