GBP-CHF Local Short! Sell!
Hello,Traders!
GBP-CHF made a retest of
The wide horizontal resistance
Of 1.0780 and we are already
Seeing a bearish pullback
So as the pair is trading in a
Downtrend we will be expecting
A further bearish move down
Sell!
Comment and subscribe to help us grow!
Check out other forecasts below too!
Disclosure: I am part of Trade Nation's Influencer program and receive a monthly fee for using their TradingView charts in my analysis.
GBP (British Pound)

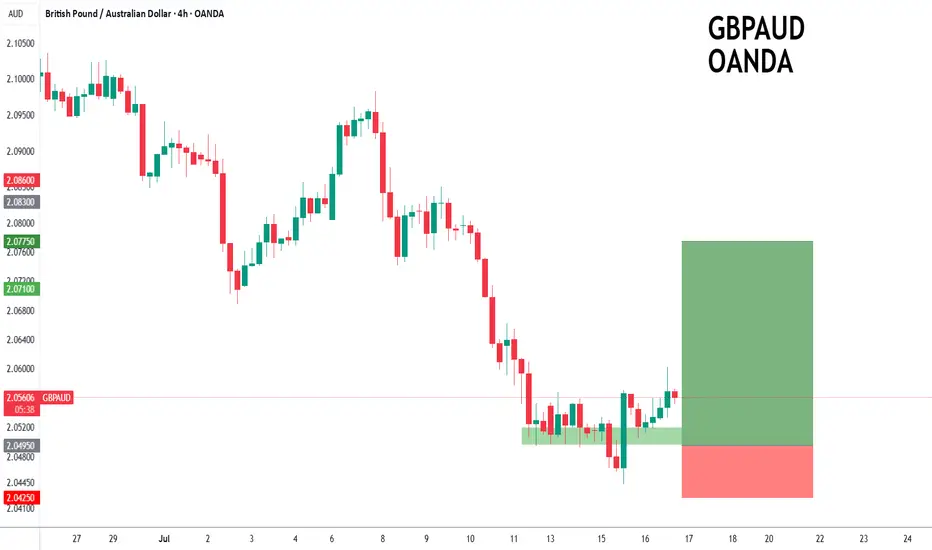
GBPAUD to turnaround?GBPAUD - 24h expiry
The primary trend remains bullish.
Price action looks to be forming a bottom.
We look for a temporary move lower.
Preferred trade is to buy on dips.
Bespoke support is located at 2.0495.
We look to Buy at 2.0495 (stop at 2.0425)
Our profit targets will be 2.0775 and 2.0820
Resistance: 2.0670 / 2.0750 / 2.0830
Support: 2.0490 / 2.0440 / 2.0400
Risk Disclaimer
The trade ideas beyond this page are for informational purposes only and do not constitute investment advice or a solicitation to trade. This information is provided by Signal Centre, a third-party unaffiliated with OANDA, and is intended for general circulation only. OANDA does not guarantee the accuracy of this information and assumes no responsibilities for the information provided by the third party. The information does not take into account the specific investment objectives, financial situation, or particular needs of any particular person. You should take into account your specific investment objectives, financial situation, and particular needs before making a commitment to trade, including seeking advice from an independent financial adviser regarding the suitability of the investment, under a separate engagement, as you deem fit.
You accept that you assume all risks in independently viewing the contents and selecting a chosen strategy.
Where the research is distributed in Singapore to a person who is not an Accredited Investor, Expert Investor or an Institutional Investor, Oanda Asia Pacific Pte Ltd (“OAP“) accepts legal responsibility for the contents of the report to such persons only to the extent required by law. Singapore customers should contact OAP at 6579 8289 for matters arising from, or in connection with, the information/research distributed.
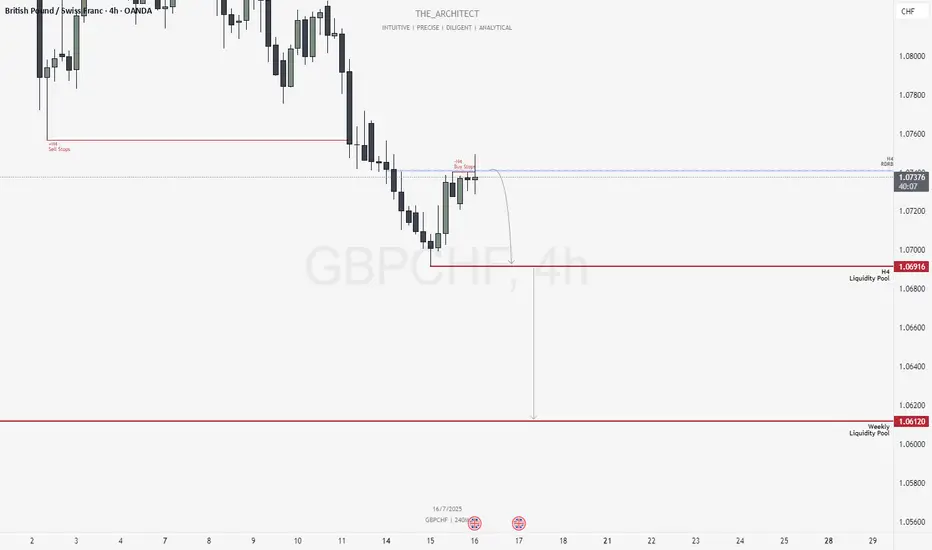
GBPCHF: Bearish Structure Aligns for Potential Sell Setups!Greetings Traders,
In today’s analysis of GBPCHF, we observe that the institutional order flow is currently bearish, and as such, we aim to align with this bias by identifying selling opportunities from key institutional resistance zones.
Higher Timeframe Context:
Weekly TF:
The weekly timeframe, which serves as our macro bias, is firmly bearish. This sentiment is reinforced on the H4 timeframe—our intermediate structure—which is also delivering consistent lower highs and lower lows. The alignment between these two timeframes strengthens our conviction to trade in the direction of institutional bearish order flow.
Key Observations on H4:
Re-delivered & Re-balanced Price Zone: Price has retraced into a previously balanced area that has now been re-delivered into, signaling institutional interest. Rejection from this zone adds to our bearish bias.
Buy Stop Raid: Price action has swept H4 buy stops in this area, providing confirmation that smart money may have used this liquidity for order pairing into short positions.
Entry Zone: The current rejection suggests a high-probability shorting opportunity from this region, provided confirmation on the lower timeframes.
Trading Plan:
Entry Strategy: Await confirmation at the current H4 resistance for short entries.
Targets: First target is the H4 liquidity pool located at discount prices. The longer-term objective is the weekly liquidity pool, which represents the primary draw on liquidity.
Continue to monitor price action closely, maintain patience for confirmation, and manage risk according to your trading plan.
Kind Regards,
The Architect 🏛️📉
GBPUSD H4 RISESDisruption Analysis – GBP/USD (4H)
🕯️ Candle Breakout Misleading
The marked “Candle Breakout” area is followed by weak bullish momentum, but lacks strong volume confirmation or higher timeframe reversal structure.
The quick rejection after the breakout may indicate a false breakout, not a sustainable trend reversal.
⚠️ Demand Zone Weakness
The “Support Area” (demand zone) has already been tested multiple times.
Multiple touches weaken the demand zone—buyers may be exhausted, increasing the chances of a breakdown instead of a bounce.
📉 Macro Trend Still Bearish
The recent sharp downtrend shows a strong bearish structure (lower highs, lower lows).
A few bullish candles are not enough to confirm a reversal—this could just be a retracement.
💣 Upcoming Fundamental Risks
The presence of multiple economic event icons (UK & US flags) indicates high-impact news—could result in unexpected volatility or trend reversals.
Fundamental factors may disrupt the projected bullish move entirely.
🎯 Bullish Target Overoptimistic
Target near 1.35000 lies within the Resistance Area, which has previously caused sharp rejections.
Without a strong breakout above 1.3400, this target is unrealistic in current market conditions.
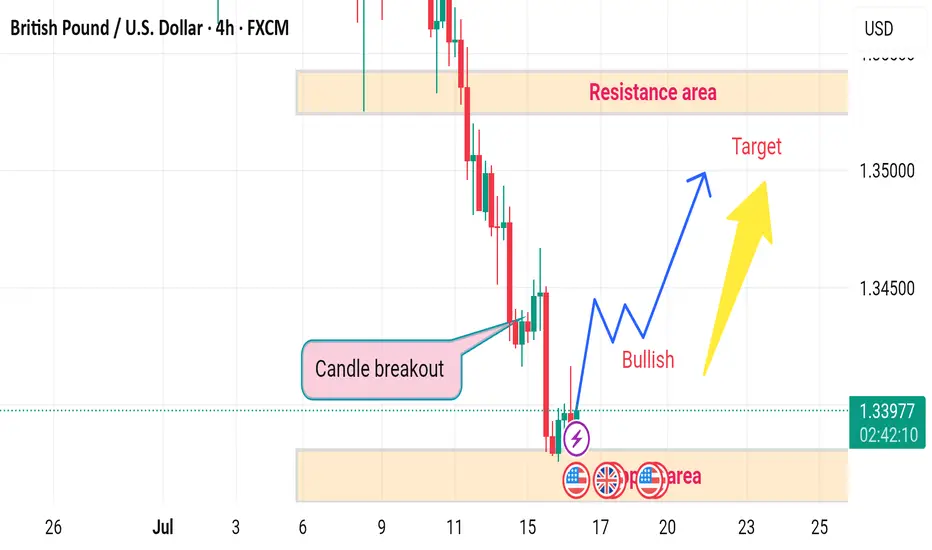
GBPUSD is Nearing the Daily Trend!!!Hey Traders, in tomorrow's trading session we are monitoring GBPUSD for a buying opportunity around 1.34100 zone, GBPUSD is trading in an uptrend and currently is in a correction phase in which it is approaching the trend at 1.34100 support and resistance area.
Trade safe, Joe.
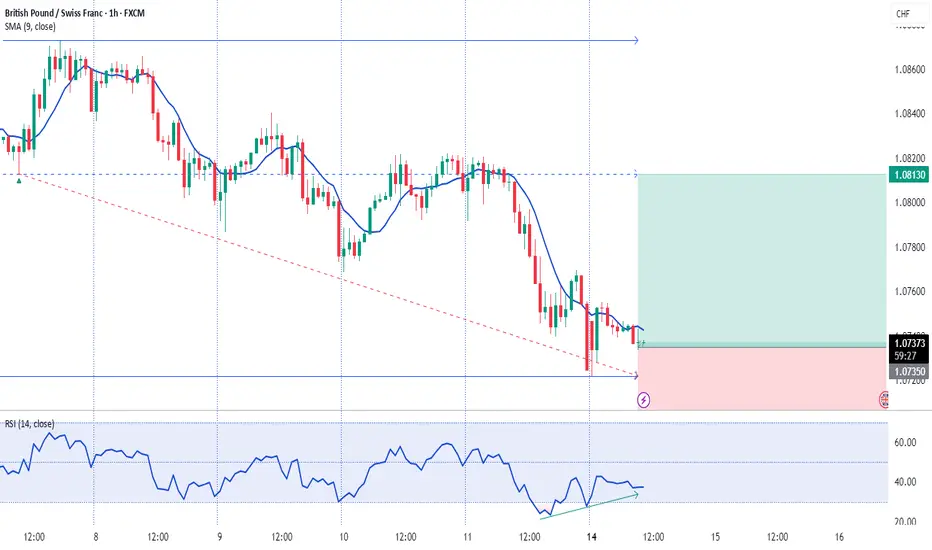
14.07.2025 #GBPHFBUY 1.07350 | STOP 1.06750 | TAKE 1.08130 | Upward price movement from local support range.
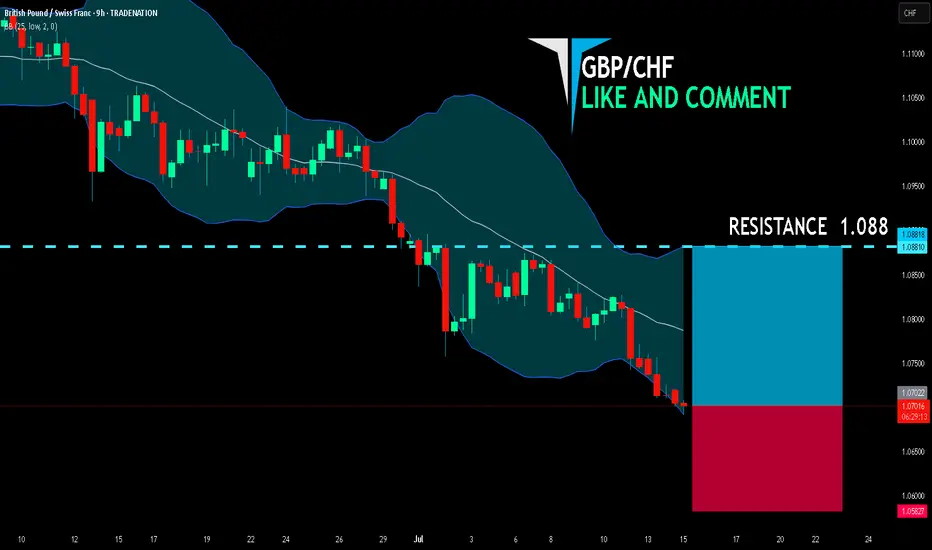
GBP/CHF BULLS WILL DOMINATE THE MARKET|LONG
GBP/CHF SIGNAL
Trade Direction: long
Entry Level: 1.070
Target Level: 1.088
Stop Loss: 1.058
RISK PROFILE
Risk level: medium
Suggested risk: 1%
Timeframe: 9h
Disclosure: I am part of Trade Nation's Influencer program and receive a monthly fee for using their TradingView charts in my analysis.
✅LIKE AND COMMENT MY IDEAS✅
Targets Hit So as you can see previously I stated that I was waiting for a breakout of the rising wedge before I entered this trade. Now it didn't go quite as planned as price made a bigger rising wedge from what I originally mapped out but nonetheless I was able to recognise, it re-adjust and enter the trade. Price hit both targets.

GBP_CHF SWING LONG|
✅GBP_CHF is set to retest a
Strong support level below at 1.0650
After trading in a strong downtrend for some time
Which makes a bullish rebound a likely scenario
With the target being a local resistance above at 1.0750
LONG🚀
✅Like and subscribe to never miss a new idea!✅
Disclosure: I am part of Trade Nation's Influencer program and receive a monthly fee for using their TradingView charts in my analysis.

$GJ (GBPJPY) 1HPrice is currently forming a descending triangle pattern, with clear lower highs and a horizontal support zone.
Trendline resistance is actively being respected.
Liquidity is likely building below the horizontal support zone.
A false breakout or sweep above the trendline followed by rejection could trigger institutional distribution.
As long as the descending trendline holds, and no bullish BOS occurs, the structure remains bearish. Look for price to accumulate short positions before expansion.

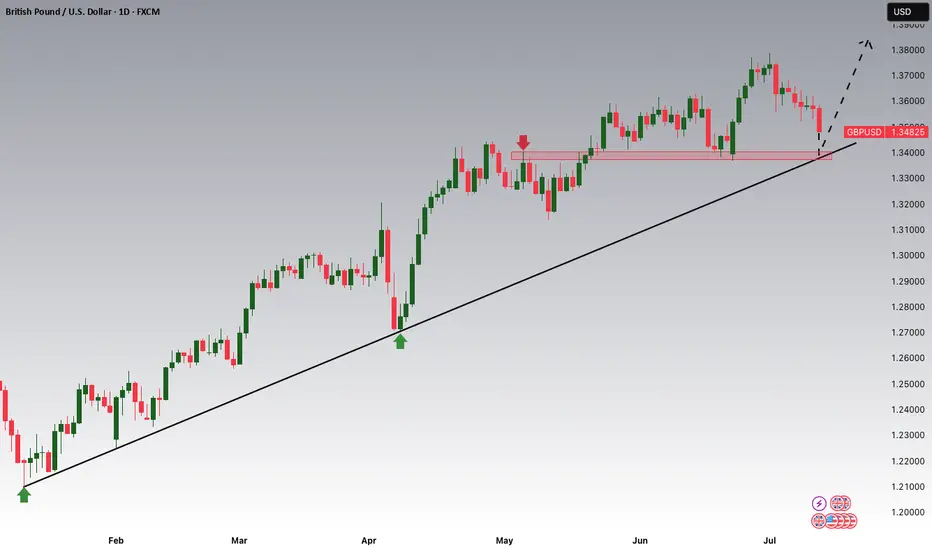
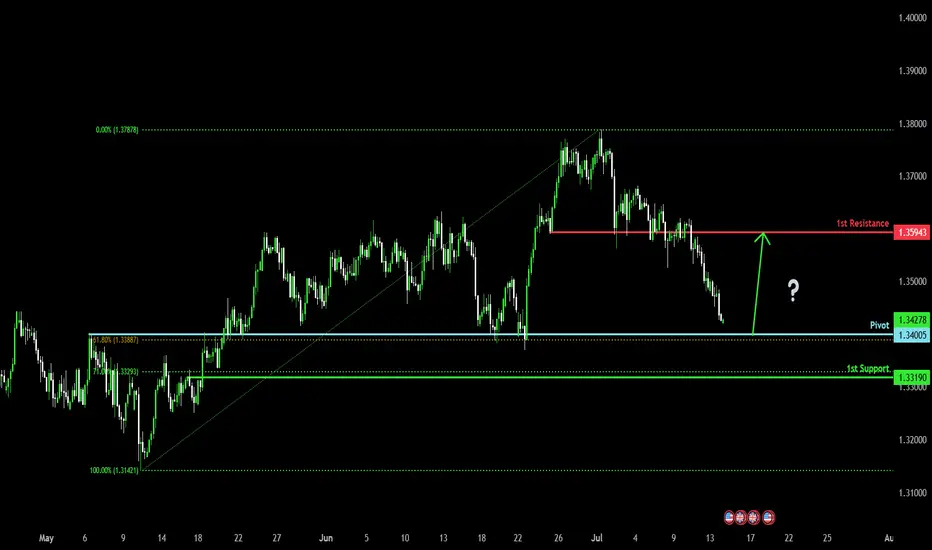
Falling towards major support?The Cable (GBP/USD) is falling towards the pivot which has been identified as an overlap support that lines up with the 61.8% Fibonacci retracement and could reverse to the 1st resistance.
Pivot: 1.3400
1st Support: 1.3319
1st Resistance: 1.3594
Risk Warning:
Trading Forex and CFDs carries a high level of risk to your capital and you should only trade with money you can afford to lose. Trading Forex and CFDs may not be suitable for all investors, so please ensure that you fully understand the risks involved and seek independent advice if necessary.
Disclaimer:
The above opinions given constitute general market commentary, and do not constitute the opinion or advice of IC Markets or any form of personal or investment advice.
Any opinions, news, research, analyses, prices, other information, or links to third-party sites contained on this website are provided on an "as-is" basis, are intended only to be informative, is not an advice nor a recommendation, nor research, or a record of our trading prices, or an offer of, or solicitation for a transaction in any financial instrument and thus should not be treated as such. The information provided does not involve any specific investment objectives, financial situation and needs of any specific person who may receive it. Please be aware, that past performance is not a reliable indicator of future performance and/or results. Past Performance or Forward-looking scenarios based upon the reasonable beliefs of the third-party provider are not a guarantee of future performance. Actual results may differ materially from those anticipated in forward-looking or past performance statements. IC Markets makes no representation or warranty and assumes no liability as to the accuracy or completeness of the information provided, nor any loss arising from any investment based on a recommendation, forecast or any information supplied by any third-party.
GBPCHF Technical Analysis! BUY!
My dear followers,
I analysed this chart on GBPCHF and concluded the following:
The market is trading on 1.0733 pivot level.
Bias - Bullish
Technical Indicators: Both Super Trend & Pivot HL indicate a highly probable Bullish continuation.
Target - 1.0775
About Used Indicators:
A super-trend indicator is plotted on either above or below the closing price to signal a buy or sell. The indicator changes color, based on whether or not you should be buying. If the super-trend indicator moves below the closing price, the indicator turns green, and it signals an entry point or points to buy.
Disclosure: I am part of Trade Nation's Influencer program and receive a monthly fee for using their TradingView charts in my analysis.
———————————
WISH YOU ALL LUCK

GBPCHF – Setting Up for a ShortWe’ve clearly marked our key resistance zone,
and now we’re patiently waiting for price to reach that level.
⚠️ Once we get a valid bearish signal,
I’ll open a short position according to plan.
🔁 If the level breaks cleanly and pulls back,
I’ll flip my bias and go long from the retest —
because I don’t marry levels,
I follow what price tells me.
We’re not here to predict.
We’re here to react, adapt, and manage risk.
The market does what it wants — and I’m ready for every scenario.

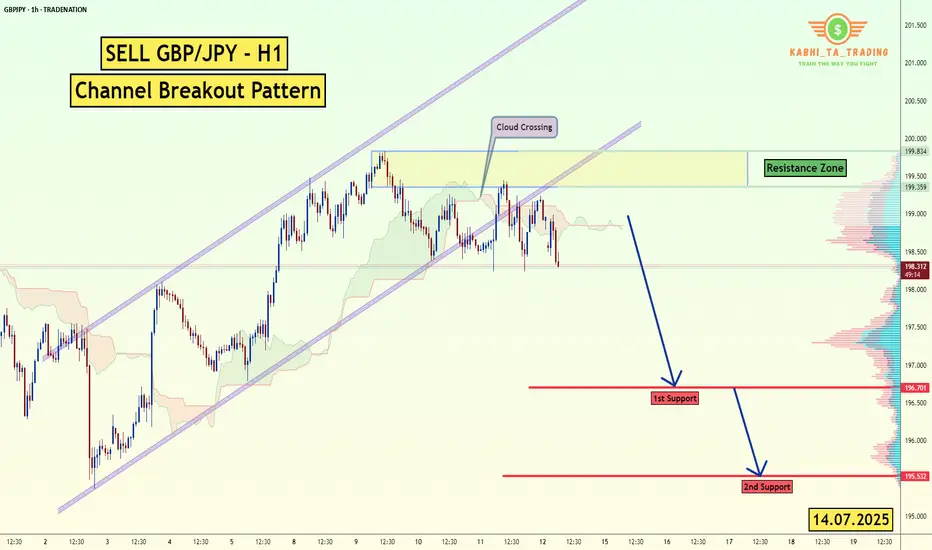
GBP/JPY -H1- Channel Breakout (14.07.2025)The GBP/JPY Pair on the H1 timeframe presents a Potential Selling Opportunity due to a recent Formation of a Channel Breakout Pattern. This suggests a shift in momentum towards the downside in the coming hours.
Possible Short Trade:
Entry: Consider Entering A Short Position around Trendline Of The Pattern.
Target Levels:
1st Support – 196.70
2nd Support – 195.53
🎁 Please hit the like button and
🎁 Leave a comment to support for My Post !
Your likes and comments are incredibly motivating and will encourage me to share more analysis with you.
Best Regards, KABHI_TA_TRADING
Thank you.
Disclosure: I am part of Trade Nation's Influencer program and receive a monthly fee for using their TradingView charts in my analysis.
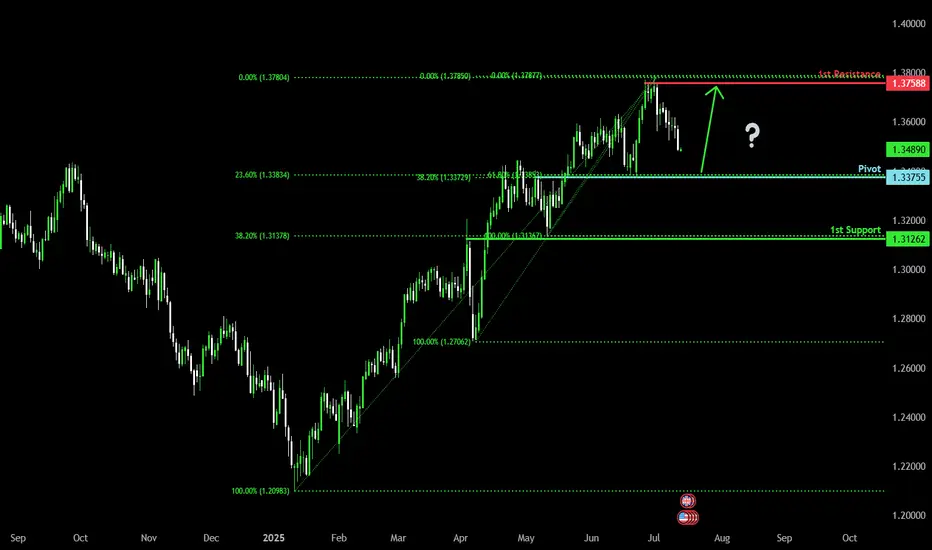
Bullish bounce off overlap support?The Cable (GBP/USD) is falling towards the pivot and could bounce to the 1st resistance which acts as a pullback resistance.
Pivot: 1.3375
1st Support: 1.3126
1st Resistance: 1.3758
Risk Warning:
Trading Forex and CFDs carries a high level of risk to your capital and you should only trade with money you can afford to lose. Trading Forex and CFDs may not be suitable for all investors, so please ensure that you fully understand the risks involved and seek independent advice if necessary.
Disclaimer:
The above opinions given constitute general market commentary, and do not constitute the opinion or advice of IC Markets or any form of personal or investment advice.
Any opinions, news, research, analyses, prices, other information, or links to third-party sites contained on this website are provided on an "as-is" basis, are intended only to be informative, is not an advice nor a recommendation, nor research, or a record of our trading prices, or an offer of, or solicitation for a transaction in any financial instrument and thus should not be treated as such. The information provided does not involve any specific investment objectives, financial situation and needs of any specific person who may receive it. Please be aware, that past performance is not a reliable indicator of future performance and/or results. Past Performance or Forward-looking scenarios based upon the reasonable beliefs of the third-party provider are not a guarantee of future performance. Actual results may differ materially from those anticipated in forward-looking or past performance statements. IC Markets makes no representation or warranty and assumes no liability as to the accuracy or completeness of the information provided, nor any loss arising from any investment based on a recommendation, forecast or any information supplied by any third-party.
GBP/JPY) Bearish Analysis Read The captionSMC trading point update
Technical analysis of GBP/JPY on the 3-hour timeframe, suggesting a potential short-term pullback within a larger ascending channel.
---
Analysis Summary
Pair: GBP/JPY
Timeframe: 3H
Current Price: 198.883
Bias: Bearish move toward channel support
---
Key Technical Insights
1. Ascending Channel Formation:
Price is moving within an upward-sloping channel.
Current structure suggests price is heading toward the lower trendline support.
2. Support Level & Target Zone:
The yellow zone around 196.355 is a major support area and target point, coinciding with both structural support and the bottom of the channel.
3. EMA (200 Close):
Price is still above the 200 EMA (197.067), so overall trend remains bullish — but current move is a correction.
4. RSI (14):
RSI is neutral near 51.14, allowing room for further downward movement before becoming oversold.
---
Target Point
Target: 196.355 (support zone and bottom of channel)
---
Trade Idea
Direction Entry Stop-Loss Target
Sell 198.80–199.00 Above 199.70 196.35
SMC trading point
---
Summary
GBP/JPY is likely to retrace toward support at 196.35 before possibly bouncing within the larger bullish structure. This offers a short-term selling opportunity, with potential buy setups near the lower trendline later.
Please support boost 🚀 this analysis)

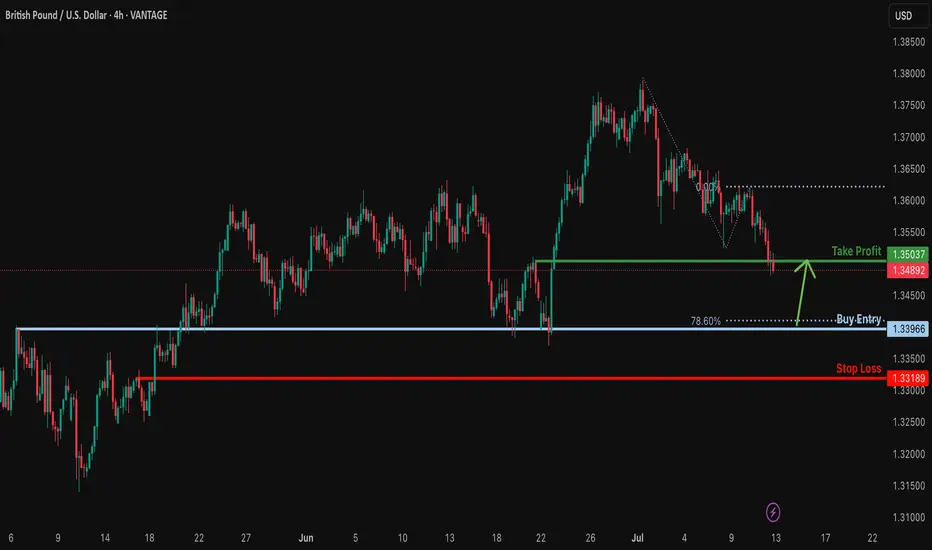
Falling towards major support?The Cable (GBP/USD) is falling towards the support which is an overlap support that lines up with the 78.6% Fibonacci projection and could bounce from this level to our take profit.
Entry: 1.3396
Why we like it:
There is an overlap support that lines up with the 78.6% Fibonacci projection.
Stop loss: 1.3318
Why we like it:
There is a pullback support.
Take profit: 1.3503
Why we like it:
There is a pullback support.
Enjoying your TradingView experience? Review us!
Please be advised that the information presented on TradingView is provided to Vantage (‘Vantage Global Limited’, ‘we’) by a third-party provider (‘Everest Fortune Group’). Please be reminded that you are solely responsible for the trading decisions on your account. There is a very high degree of risk involved in trading. Any information and/or content is intended entirely for research, educational and informational purposes only and does not constitute investment or consultation advice or investment strategy. The information is not tailored to the investment needs of any specific person and therefore does not involve a consideration of any of the investment objectives, financial situation or needs of any viewer that may receive it. Kindly also note that past performance is not a reliable indicator of future results. Actual results may differ materially from those anticipated in forward-looking or past performance statements. We assume no liability as to the accuracy or completeness of any of the information and/or content provided herein and the Company cannot be held responsible for any omission, mistake nor for any loss or damage including without limitation to any loss of profit which may arise from reliance on any information supplied by Everest Fortune Group.
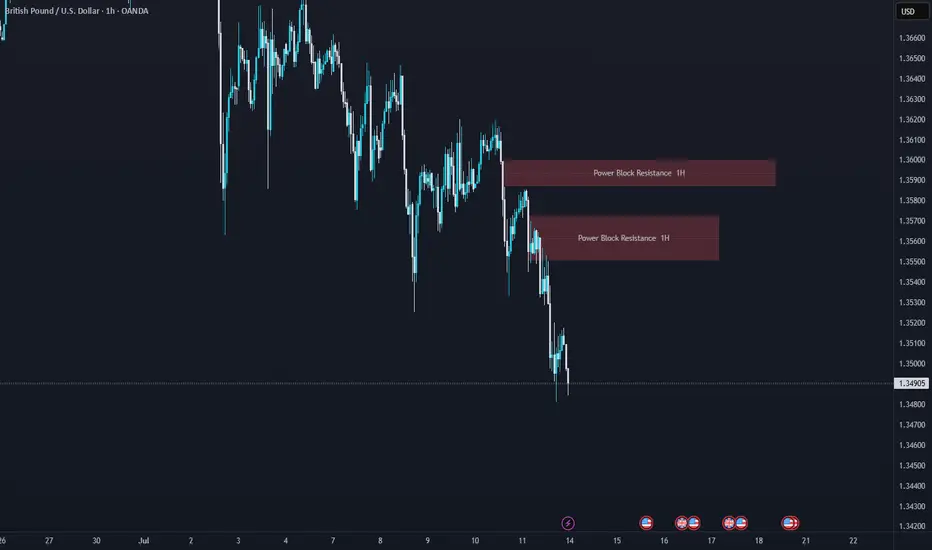
GBPCHF is Ready for a breakthroughHello Traders
In This Chart GBPCHF HOURLY Forex Forecast By FOREX PLANET
today GBPCHF analysis 👆
🟢This Chart includes_ (GBPCHF market update)
🟢What is The Next Opportunity on GBPCHF Market
🟢how to Enter to the Valid Entry With Assurance Profit
This CHART is For Trader's that Want to Improve Their Technical Analysis Skills and Their Trading By Understanding How To Analyze The Market Using Multiple Timeframes and Understanding The Bigger Picture on the Charts

GBPUSD Bearish Signal | Technical + Custom AlgoSmart Trend Signal | Technical Analysis + Custom Algorithm
This signal is the result of a combination of classic technical trend analysis and a proprietary software I personally developed.
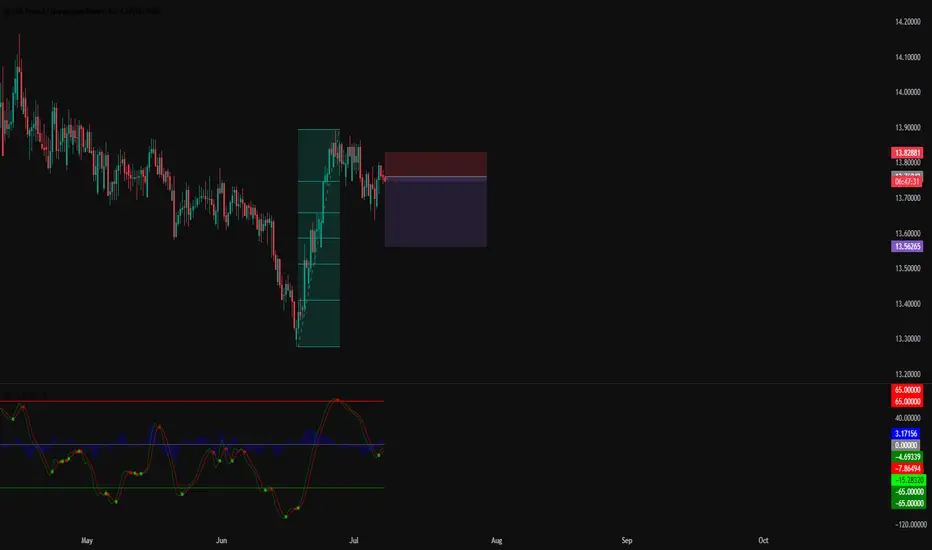
#008: GBP/NOK SHORT OPPORTUNITY
Hi, I'm Forex Trader Andrea Russo and today I want to show you this GBP/NOK SHORT opportunity. After a strong upside extension, GBP/NOK is showing signs of exhaustion just below the key resistance zone of 13.83. I thank in advance my Official Broker Partner PEPPERSTONE for the support in writing this article.
📍 Technical Context
The pair has recently formed a local double top with declining bullish momentum. Price action around the highs is becoming increasingly choppy, suggesting the presence of smart investors preparing a possible reversal.
A clear rejection from the 13.82-13.83 zone triggered the short setup, with confirmation coming from broader market dynamics and a favorable risk/reward structure.
🔍 Macro Overview
The British pound remains under pressure as uncertainty over the Bank of England's next rate decision weighs on the currency.
The Norwegian krone finds support in stable oil prices and expectations of relatively tight monetary policy.
This macro imbalance creates a favorable backdrop for a potential downside continuation.
This setup aligns both technical exhaustion and cross-market forces, while sentiment data reveals a bearish bias among retail on GBP/NOK, often a good time to ease pressure.
🔄 Next Steps
As always, I will be monitoring the price action on a candle-by-candle basis. If the downside momentum confirms, the pair could retest the 13.56 support in the coming sessions.
📌 Stay tuned for live updates and trade management.
GBP-CHF Bearish Breakout! Sell!
Hello,Traders!
GBP-CHF is trading in a strong
Downtrend and the pair
Broke the key horizontal
Level around 1.0780 which
Reinforces our bearish
Bias and we will be
Expecting a further
Bearish move down
On Monday!
Sell!
Comment and subscribe to help us grow!
Check out other forecasts below too!
Disclosure: I am part of Trade Nation's Influencer program and receive a monthly fee for using their TradingView charts in my analysis.

EURGBP SHORT – WEEKLY FORECAST Q3 | W29 | Y25💼 EURGBP SHORT – WEEKLY FORECAST
Q3 | W29 | Y25
📊 MARKET STRUCTURE SNAPSHOT
EURGBP is currently reacting from a key higher time frame supply zone, with price action showing weakness at premium levels. Momentum has slowed, and early signs of distribution are appearing. With structure aligning bearishly across multiple timeframes, the pair presents a short bias opportunity.
🔍 Confluences to Watch 📝
✅ Daily Order Block (OB)
Price reacted from a high-probability bearish OB.
Rejection wicks and a shift in candle body control point to supply dominance.
Momentum is fading, confirming the presence of smart money sellers.
✅ 4H Order Block
Clear mitigation of 4H OB followed by an internal break of structure (iBoS).
Price is respecting the OB zone, printing lower highs beneath key supply.
Perfect mid-timeframe confirmation of trend transition.
✅ 1H Order Block
1H structure shifted bearish, validating LTF trend alignment.
Price building supply chain with continued lower highs and bearish engulfing patterns.
Ideal zone for entry on pullback or liquidity sweep.
📈 Risk Management Protocols
🔑 Core Principles:
💰 Max 1% risk per trade
📍 Only execute at pre-identified zones
⏰ Set alerts — avoid impulsive trades
📉 Respect RR — minimum 1:2 per position
🧠 You're not paid for frequency. You're paid for discipline and execution quality.
🧠 Weekly FRGNT Insight
“Trade what the market gives, not what your ego wants.”
Stay mechanical, stay focused, and allow the probabilities to play out. Your job is to control risk — not the outcome.
🏁 Final Thoughts from FRGNT
📌 The structure is clear.
📌 The confluences are stacked.
📌 The bias is confirmed.
Let your execution reflect your discipline, not your emotions.
❤️ Good luck this week, and as always – I’ll see you at the very top.

GBP/USD - H1- Bearish Flag (07.07.2025)The GBP/USD Pair on the M30 timeframe presents a Potential Selling Opportunity due to a recent Formation of a Bearish Flag Pattern. This suggests a shift in momentum towards the downside in the coming hours.
Possible Short Trade:
Entry: Consider Entering A Short Position around Trendline Of The Pattern.
Target Levels:
1st Support – 1.3520
2nd Support – 1.3460
🎁 Please hit the like button and
🎁 Leave a comment to support for My Post !
Your likes and comments are incredibly motivating and will encourage me to share more analysis with you.
Best Regards, KABHI_TA_TRADING
Thank you.
Disclosure: I am part of Trade Nation's Influencer program and receive a monthly fee for using their TradingView charts in my analysis.
