GBPCAD TO BUY (LONDON BREAKOUT)GBPCAD is oversold, and showing signs of support. Therefore, we are looking to make buy with this pair.
TP: 1.733 OR ABOVE
Gbp-cad


Don't miss the great buy opportunity in GBPCADTrading suggestion:
. There is a possibility of temporary retracement to suggested support line (1.7310). if so, traders can set orders based on Price Action and expect to reach short-term targets.
Technical analysis:
. GBPCAD is in a range bound and the beginning of uptrend is expected.
. The price is above the 21-Day WEMA which acts as a dynamic support.
. The RSI is at 55.
Take Profits:
TP1= @ 1.7428
TP2= @ 1.7534
TP3= @ 1.7673
TP4= @ 1.7793
TP5= @ 1.8033
SL= Break below 1.7235
❤️ If you find this helpful and want more FREE forecasts in TradingView
. . . . . Please show your support back,
. . . . . . . . Hit the 👍 LIKE button,
. . . . . . . . . . Drop some feedback below in the comment!
❤️ Your Support is very much 🙏 appreciated! ❤️
💎 Want us to help you become a better Forex trader ?
Now, It's your turn !
Be sure to leave a comment let us know how do you see this opportunity and forecast.
Trade well, ❤️
ForecastCity English Support Team ❤️

GBPCAD - SWING - 18. AUGU. 2020Welcome to our weekly trade setup ( GBPCAD )!
-
1 HOUR
Market turned bullish right now.
4 HOUR
Strong pressure and price action..
DAILY
Overall bullish market in bearish downtrend, good long entries!
-
FOREX SWING
BUY GBPCAD
ENTRY LEVEL @ 1.73420
SL @ 1.72520
TP @ 1.74750
Max Risk. 0.5% - 1%!
(Remember to add a few pips to all levels - different Brokers!)
Leave us a comment or like to keep our content for free and alive.
Have a great week everyone!
ALAN


GBP/CAD Long To 1.76565This is a buy trade I took last week and expecting further upside into this coming trading week. I bought at 1.73055 and have targets set at 1.76395 - The reasoning behind the trade was simple for me. We had price come back to retest support which lined up perfectly with the 200 EMA which also lined up with a 61.8% pullback. price was oversold on the stochastics and at the time I executed the trade we had a bullish engulfing candle bounce from the 200 EMA.
Although I realise it's a bit late to enter where I did if price were to pull back to 1.73280 that would be another opportunity to go long.

GBPCAD !! Will it find support for Uptrend ?The bullish trend line broke, but the region that it broke is strong support zone, the trend broken from this region gets support and strengthens so we set our risk and profit rate logically, we will watch and see.
Please like the idea for Support & you can share your ideas and charts in Comments Section .. !!

GBPCAD Sell1.72120 is the target for this trade, I believe the current level will be broken and we'll see downward movement. Based off the indicators on the chart including Williams Alligator


GBP/CAD AS WE PLANNEDGBP/CAD went the same as we planned, now the question is whether it will break the structure around 1.74800 area, or will continue down to a deeper retest towards 1.71800 area. But since bad news is expected for GBP next week, and for CAD was good past week, I think it will definitely go for a deeper retest.

GBPCAD Update: Profit=14920 pip SL=3000 Reward/Risk > 4.9 :1 Trade Setup summary:
Profit targets=14920 pip (750 + 1230 + 2690 + 3850 + 6400)
Stop Loss =3000 pip
Reward/Risk > 4.9: 1
Current Status:
Total Profit: 3588 pip
Closed trade(s): 1980 pip Profit
Open trade(s): 1608 pip Profit
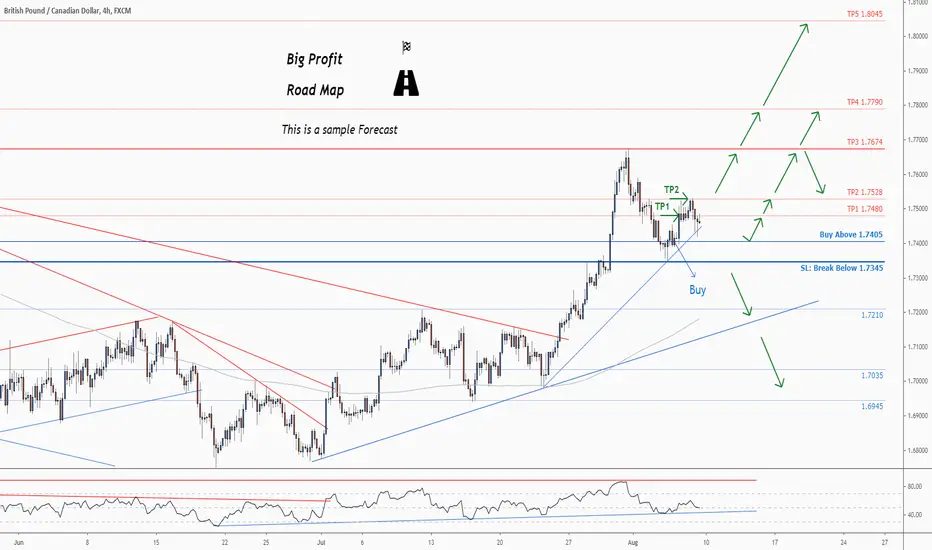
Trade Setup:
We opened 5 BUY trade(s) @ 1.74050 based on 'previous Forecast' at 2020.08.05 :
Closed Profit:
TP1 @ 1.7480 touched at 2020.08.06 with 750 pip Profit.
TP2 @ 1.7528 touched at 2020.08.06 with 1230 pip Profit.
750 + 1230 = 1980
Open Profit:
Profit for one trade is 1.74586(current price) - 1.74050(open price) = 536 pip
3 trade(s) still open, therefore total profit for open trade(s) is 536 x 3 = 1608 pip
Technical analysis:
. GBPCAD is in a range bound and the beginning of uptrend is expected.
. The price is above the 21-Day WEMA which acts as a dynamic support.
. The RSI is at 50.
New Trading suggestion:
. There is still a possibility of temporary retracement to suggested support line (1.7405) again. if so, traders can set orders based on Price Action and expect to reach short-term targets.
New Take Profits:
TP1= @ 1.7480
TP2= @ 1.7528
TP3= @ 1.7674
TP4= @ 1.7790
TP5= @ 1.8045
SL= Break below S2
❤️ If you find this helpful and want more FREE forecasts in TradingView
. . . . . Please show your support back,
. . . . . . . . Hit the 👍 LIKE button,
. . . . . . . . . . . Drop some feedback below in the comment!
❤️ Your Support is very much 🙏 appreciated!❤️
💎 Want us to help you become a better Forex trader?
Now, It's your turn!
Be sure to leave a comment let us know how do you see this opportunity and forecast.
Trade well, ❤️
ForecastCity English Support Team ❤️
GBPCAD - SWING - 04. AUGU. 2020Welcome to our weekly trade setup ( GBPCAD )!
-
1 HOUR
Market about to turn bearish..
4 HOUR
Bearish price action and pressure formed, good short entries!
DAILY
Overall bullish market about to break back towards previous lows.
-
FOREX SWING
SELL GBPCAD
ENTRY LEVEL @ 1.74750
SL @ 1.76470
TP @ 1.72060
Max Risk. 0.5% - 1%!
(Remember to add a few pips to all levels - different Brokers!)
Leave us a comment or like to keep our content for free and alive.
Have a great week everyone!
ALAN

Don't miss the great buy opportunity in GBPCADTrading suggestion:
. There is a possibility of temporary retracement to suggested support line (1.7405). if so, traders can set orders based on Price Action and expect to reach short-term targets.
Technical analysis:
. GBPCAD is in a range bound and the beginning of uptrend is expected.
.The price is above the 21-Day WEMA which acts as a dynamic support.
. The RSI is at 49.
Take Profits:
TP1= @ 1.7480
TP2= @ 1.7528
TP3= @ 1.7674
TP4= @ 1.7790
TP5= @ 1.8045
SL= Break below S2
❤️ If you find this helpful and want more FREE forecasts in TradingView
. . . . . Please show your support back,
. . . . . . . . Hit the 👍 LIKE button,
. . . . . . . . . . . Drop some feedback below in the comment!
❤️ Your Support is very much 🙏 appreciated! ❤️
💎 Want us to help you become a better Forex trader ?
Now, It's your turn !
Be sure to leave a comment let us know how do you see this opportunity and forecast.
Trade well, ❤️
ForecastCity English Support Team ❤️

GBP/CAD is a Short.Hey, I am back with another Short setup with GBP.
Looking at GBP/CAD, which has broken the uptrend line is going towards 1.72900 - 1.73000 area.
Ideal short entry ( My entry level ) 1.73399.
Good luck with trading!

GBPCAD long wayI expect it to start moving up from the support zone, I have 2 targets
Please support by leaving LIKE


GBP/CAD Bullish View by ThinkingAntsOk🔸 4H CHART EXPLANATION:
.
.
🔸Price bounced at the Weekly Ascending Trendline.
.
🔸It has broken the Descending Trendline and the Resistance Zone.
.
🔸We consider that it has potential to make an upside move towards the Resistance Zone at 1.7700 .
.
🔸 Will look for a lower timeframe bullish setup.
🔸 DAILY CHART ANALYSIS:

GBPCAD: Classic Retest Setup
GBPCAD has recently broken and closed above a key daily level.
now the price retests that level.
on 1H we see a falling wedge pattern.
bullish breakout of that (1h candle close above) will give us the perfect opportunity to catch a bullish movement.
initial target:
1.7245
safest stop is below the last low within the wedge.
if the market breaks the support of the wedge, setup will be invalid

GBPCAD reaching support, potential bounce | 27 July 2020 Price is approaching support where we could see a bounce above this level.
