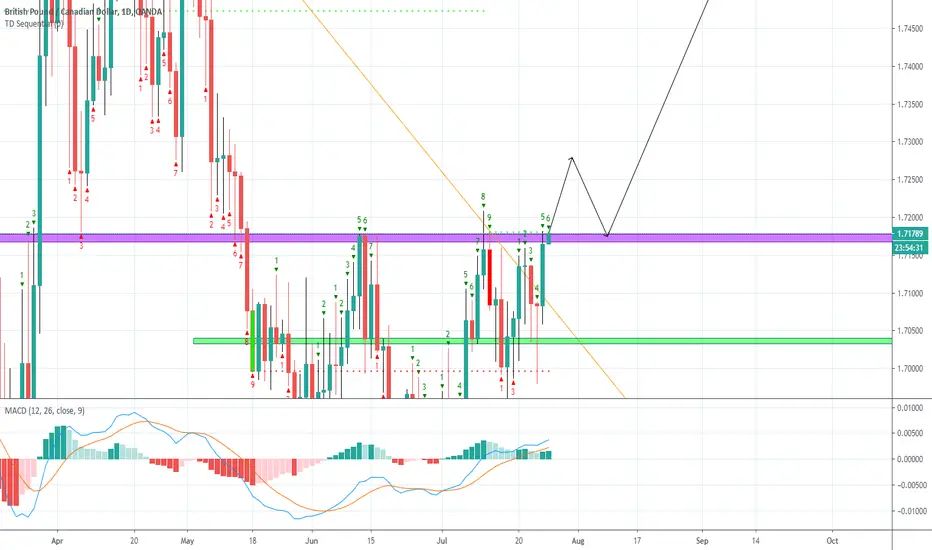
GBP/CADPersonally for Gbp / Cad I think it will break through and go to fill out the form above so we are just waiting for it to break through to daily and get into a safe long term.
Gbp-cad

GBP/CAD: Selling it for a 35-pip trade The pair is currently bearish with GBP being very weak today.
As you can see in my chart, price :
- broke the flag downards
- is below the daily pivot level
- is below all EMA
I am targeting the next fib level @ 1.70140 levels. It's a 35-pip trade.
Check out my past analysis!
Trade at your own risk

Same zones as previously Published! Same zones previously published!
First zone it wiped out "candle broke" -1%
Second zone +4%
Stops at B/E

GBPCAD approaching support | 22 July 2020 Price is approaching support where we are expecting a bounce above this level.

GBPCAD sell trade idea.GBPCAD sell from 1.7100 area aiming for 1.6900 closes. Stops set at 1.71600 closes on H4.


Gbp/Cad channel trade .. Gbp / cad is stuck in the channel, so until the price breaks up or down there is no interest, unless you are a channel trader, so you can catch prices between 68,200 long and 71,500 short.

GBPCAD liquidity grab?If price holds up 1.69626 on a 4H candle close, price is likely to go higher before another drop.

GBPCAD IS LOOKING BULLISH!Momentarily GC is looking to turn things around, and go towards the BULLS! I expect price to bounce off my bottom channel line. There are plenty of TP opportunities and a lot of pips to catch! I personally am going to set a buy stop order @1.69800 and set 2 TPs.
First TP: 1.70130
Second TP: 1.7000

GBP CAD - Short FlashcardGBP CAD - Short Flashcard
- Pair in bearish trend
- Pair presented with a double top which was stopped out after entry
- Then another double top appeared with divergence @ 68 and a false bullish channel
- Entry was on the second leg close below 13 ema
- Stop 15 pips above second leg high
- TP1 @ 800 ema
- Trade close @ RSI cross into volatility bands @ 32 and Signal line @ 110 pips

GBPCAD Short - FlashcardGBPCAD Short
Direction: - Momentum on the H4 was Bearish.
- The pair entered a Bearish OB (Orderblock) on the H4.
- The pair filled in the FVG (fair value gap) on the H4, before dropping.
- The pair retested the last level of the Bullish Cycle.
Entry: - M (Double Top) Pattern Formation.
- 13 EMA cross indicates probable continuation in drop.
- Divergence.
- RSI near the 68. This shows that the pair is near exhausted and overbought.
- Squeeze in volatility bands between the 50 & 68 indicate a sudden burst will occur downwards.
- MBL (Market Base Line) pointing down above the 50 indicates drop.
Exit: - 35 pip SL @ above high.
- 70 pip TP 1 @ 800 EMA, as this can act as a resistance point..
- 120 pip TP 2 @ just above YL.

GBP/CAD Daily Forecast (14th July)I see today's opportunity on a GBP/CAD hourly chart.
A trend line break has occurred, however, RSI is close to the oversold range. A retest may follow back to the trend line, after which another wave of sales may break through the key level as well. This is an excellent short option for us, with a pending order we can easily board when it happens.

GBP/CAD: Buying @ market, targeting confluence zone! The pair has broken its current arc to the upside which acted perfectly as a resistance since yesterday. This is showing buyers are coming in the game.
We have a confluence zone which is shown by the pink + white fibo levels (short-term and long-term price action). As you can see these levels match perfectly.
This confluence zone will be my target, around 1.71050 levels. It should attract prices since it's the reunion of 2 (or more) fib levels.
Trade at your own risk

GBP/CAD: Bearish sentiment - Looking for the short entry!Good Afternoon,
The pound has been bearish this week, if you followed my trades last week I made a healthy profit on GBPUSD trade which I was looking to hold longer however I closed that yesterday and banked some profits and will look to re-enter long if I see a new opportunity.
With this pair price seems to be moving south also - from the chart you can see the ascending trendline has been broken and if you look at the key S/R levels there could be some good points of entry for a short. I will personally wait for a retest of trendline and/or the support turned resistance above before making a move.
Let me know what you think!
Thanks!

GBP/CAD: Buying the pullback, but why? The current blue curve which supported the pair multiple times was broken on July 13, 2020.
I am buying the pullback assuming today's prices have reached a bottom.
As you can see, we have high volume node (HVN) around the 61.8% fib level which is my level of interest (target), suggesting it could face a strong resistance at these levels.
Trade at your own risk

GBPCAD: Harmonics, Candles & Patterns
hey guys,
GBPCAD is trading on a key daily structure resistance.
The price formed a completed harmonic bearish bat pattern.
Friday's daily candle was rejected.
on 4H the price is contracting within a rising wedge pattern.
after an attempt to break through the daily structure, the price has formed the inside bar candlestick formation.
1.714 - 1.7207 is the range of the mother's bar.
this pattern signifies complete indecision.
though it can be broken to both sides, we will trade it only in case of a bearish violation because of our daily bearish bias.
we need 4H candle close below the mother's bar range to confirm the violation.
then we can short on retest aiming at
1.707
1.703
in case of a bullish violation of mother's bar, I won't trade and setup will be canceled.

FX journey #2 | Position 1Here are some reasons, we have uptrend here. We have also our Stop loss under the channel's support.
This journey is similar to tradingviews paper trading so do not risk your money.

GBPCAD Double Bottom OTWNoticed a double bottom on the daily timeframe and placed a long trade at a price where the reversal should be confirmed.
The RSI is also rising which supports the long trade suggestion.

GBP CAD SELL (POUND STERLING - CANADIAN DOLLAR)Hi there. Price is forming a reversal pattern to change its direction. Watch strong price action at the current levels for sell.


GBPCAD ANALYSISStrong bullish wave (a) ended at level 1.7025 after breaking downtrendline
then corrective bearish wave (b) rejected from demand zone at level 1.6875 which corresponds to 61.8% Fibonacci level
Price is based above HVN at level 1.6909 which indicates that pair is in accumulation phase
MACD shows bullish momentum
RSI is above level 50
It's expected for coming strong bullish wave (c) to target first resistance level at 1.7025
then finally target supply zone at level 1.7175
