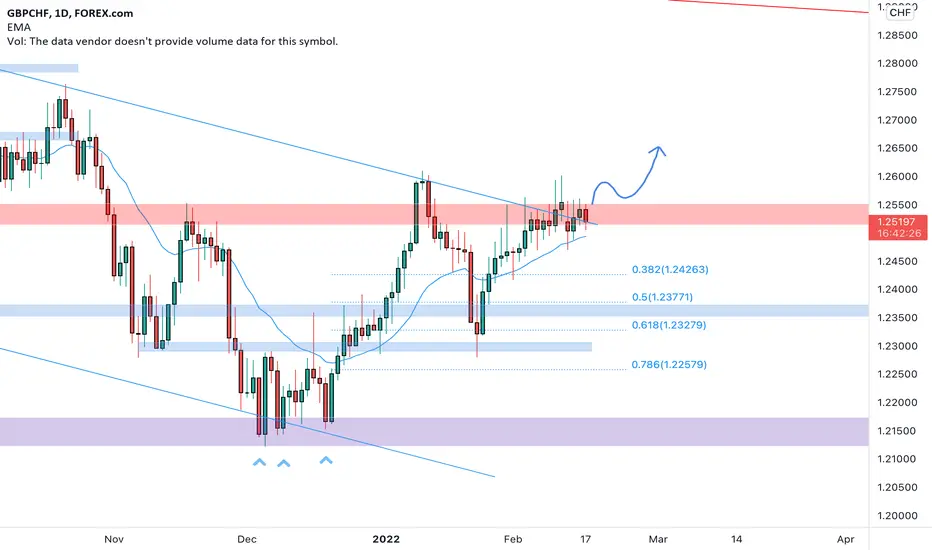
GBPCHF testing a weekly resistance 🦐GBPCHF on the daily chart is testing a confluence zone between the weekly resistance and a descending trendline.
The price after a triple bottom over the monthly support started a bullish move with an impulse to the upside and retraced back to the 0.618 Fibonacci level.
How can we approach this scenario?
We will wait for the European market to open and check if the bulls will have enough strength to break above the resistance area .
In that case, we will move on the 4h timeframe and if the price will break and retest the structure we will check for the application of the Plancton academy rules to set a nice long order.
--––
Follow the Shrimp 🦐
Keep in mind.
🟣 Purple structure -> Monthly structure.
🔴 Red structure -> Weekly structure.
🔵 Blue structure -> Daily structure.
🟡 Yellow structure -> 4h structure.
⚫️ Black structure -> <4h structure.
Here is the Plancton0618 technical analysis , please comment below if you have any question.
The ENTRY in the market will be taken only if the condition of the Plancton0618 strategy will trigger.
GBP-CHF
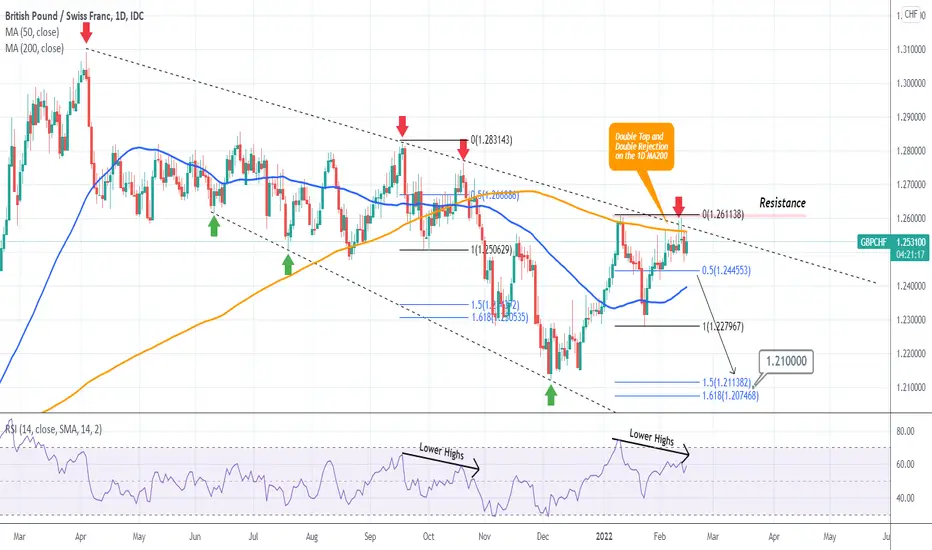
GBPCHF Sell signal: Lower High and 1D MA200 rejectionGBPCHF has been trading within a Bearish Megaphone pattern almost since the start of 2021. At the moment it is trading sideways for more than a week in a row but even though it has tested the 1D MA200 (orange trend-line) on multiple occasions, it has failed to close a 1D candle above it and make a bullish break-out.
On top of that, the 1D MA200 rejection, is also a Double Top rejection on the 1.26125 Resistance level. Also the 1D RSI is on Lower Highs, which that was the formation on the pairs last rejection at the top of the Megaphone on October 20 2021. The result of that Lower High top was a price dive to the 1.5 - 1.618 Fibonacci extension levels once the 0.5 level broke.
At the moment the 0.5 Fib level is at 1.24455. If that breaks, I will take it as a sell signal with a 1.21000 target (within the 1.5 - 1.618 Fib extension zone).
--------------------------------------------------------------------------------------------------------
** Please support this idea with your likes and comments, it is the best way to keep it relevant and support me. **
--------------------------------------------------------------------------------------------------------
GBPCHF Daily ForecastGbp Is taking a leap down the hill and as we can see across all gbpxxx pairs will be affected. But i will be focusing more on gbpchf as i have seen this sweet retracement from resistance. I believe this pair will see lots of pips down before buyers come in.

GBPCHF LongHey traders, in the coming week we are monitoring GBPCHF for a long term buying opportunity around 1.25 zone, once we will receive any bullish confirmation the trade will be executed.
Trade safe, Joe.

GBPCHF ShortHey traders, in today's trading session we are monitoring GBPCHF for a long term selling opportunity around 1.254 zone, once we will receive any bearish confirmation the trade will be executed.
Trade safe, Joe.

GBPCHF a turn at the 0.618 🦐GBPCHF on the daily chart is testing a confluence zone between the weekly resistance and a descending trendline.
The price after a triple bottom over the monthly support started a bullish move with an impulse to the upside and retraced back to the 0.618 Fibonacci level.
How can we approach this scenario?
We will wait for the European market to open and check if the bulls will have enough strength to break above the resistance area.
In that case, we will move on the 4h timeframe and if the price will break and retest the structure we will check for the application of the Plancton academy rules to set a nice long order.
--––
Follow the Shrimp 🦐
Keep in mind.
🟣 Purple structure -> Monthly structure.
🔴 Red structure -> Weekly structure.
🔵 Blue structure -> Daily structure.
🟡 Yellow structure -> 4h structure.
⚫️ Black structure -> <4h structure.
Here is the Plancton0618 technical analysis , please comment below if you have any question.
The ENTRY in the market will be taken only if the condition of the Plancton0618 strategy will trigger.

GBPCHF ShortWe have a strong downtrend because at the daily timeframe we are at the resistance.
At the 4H timeframe we can open a short position because the trend line has broken and retested.
Also indicators confirm the short position.
Stay tuned for more awesome technical analysis.
Cheers :)

UPDATE 2.0 - GBPCHF - CONT or BREAK-OUT
Good Evening people…
The new Trading week is upon us and with this I would like to revisit the Technical Analysis of the GBPCHF
The initial post was 10 days ago and the market had progressed slightly towards our target zone for a potential trade set-up
[For the initial Technical Analysis follow the link below ]
Moving on to the progression of the chart and further Technical Analysis
Previously, Top-Down Analysis of the Monthly & Weekly were provided.
Both timeframes remain pretty much identical - Other than the previously identified Pin-Bar
Now, I did predict that this particular Pin-Bar may just return to the 1.235 Support , which is also a 61 FIB zone for the previous Low [ 1.299 ]
With, the Pin-Bar being the a new Higher-High in theory
Furthermore, I did mention that Price would bounce off this level - And, It did precisely that!
Additionally, This bounce closed back above a newly marked out Horizontal S&R
Which brings us to the Daily TF…
On the Daily - We can see that our previously marked out Descending Channel is still intact
Furthermore, you can see the additional Horizontal S&R I marked out
This has been closing out on a daily basis at the back end of last week
Moving Down to the H4 …
We can see that the market did Break-Out of the Support of the previously marked out Ascending Channel
Following this Break-Out - Price bounced off the 1.235 Support and has been in a strong trend for the majority of last week
This being our originally predicted zone of Confluence and target for potential trade set-ups
As I previously mentioned - This is an abundance of Confluence
Being a meeting of the H4 Ascending Channel Support Resistance of the Daily Descending Channel and Horizontal Resistance [ Beautiful, right? ]
With this in mind, I am still looking for the following…
At this 1.2599 Confluence - A Break-out with a Daily Close before any long positions can be considered
Alternatively, any type of Bearish Price Action CS or simply rejections would have to be considered as Shorts
Also, I will be monitoring both the H4 and Daily TFs - As, they both currently seem to be respected at the levels on these TFs
[ I am expecting this to alter though ]
Although, on the H4 - After the Break-Out , Price reached the Support within 10 sessions
But, has taken considerably more and still moving to reach the new Resistance of the Ascending Channel
This personally being a chart pattern that is preferred to a similar period of sessions for returning to the new S&R after a Break-Out
Finally, We do have a Monthly close upon us this week - Such a close my provide us with further clues as to the future movement of the market
If anyone is following the original GBPCHF Technical Analysis - I hope this has provided an alternative insight to the chart
Thanks for tuning in people & Stay Cool!

GBPCHF - DESCENDING [D] BREAKOUT or?
Good Evening People...
And, The Finale of the analysis for today - Working Hard!
[Moving on to TradingView , I have had to set all the charts up again - But, its something that refreshes the mind for me - Positivity!]
This evening I have been looking at the GBPCHF
With this and as always - I began with a Top-Down Analysis
Lets cut to the raw stuff...
On the Monthly - We have a Bearish Trendline and also being respected on the Weekly
The last visit to this diagonal resistance was back in 2016
Throughout this time - The market has dropped slightly and proceeded to range
Moving on to the Weekly - I have the aforementioned Range marked out
Now, last week - We did have a relatively small Pin-Bar present itself
[Don't get scared - I am thinking this may just return to the 1.235 zone - This being a 61FIB too]
And, bounce :l
Now the interesting and trade-able stuff...
The Daily Timeframe
On the Daily, I have identified a Descending Channel
The market is working it's way up to the Resistance of the channel and coincidently, it will meet Horizontal Resistance [ But, not before that H4 Pin-Bar has been honoured, right?]
And...
Whilst on the topic of the H4 - I would like to mention the Ascending Channel I have marked out on this timeframe
The market is currently testing the Support of this channel
If we look back at the Descending Channel Resistance on the Daily - We can see an abundance of Confluence
The meeting of the H4 Ascending Channel Support , Resistance of the Daily Descending Channel and Horizontal Resistance [ Beautiful, right? ]
At this 1.2599 Confluence I am looking for a Breakout with a Daily Close before any long positions can be considered
Alternatively, any type of Bearish Price Action CS would have to be considered as Shorts
Thats it for today people - Good Night & Sleep Well
Thanks for tuning in - Peace Out!

UPDATE 3.0 - GBPCHF - CONT or BREAK-OUT
UPDATE 3.0
GBPCHF
Hope everyone has a good weekend...
Today, I will be kicking off with a revisit to the GBPCHF
As you guys may be aware - I have previously provided Technical Analysis for this currency and have been watching for the best part of the last 3 weeks
You can find the previous analysis at both the links below…
...
So, within the previous analysis - I discussed how the market was progressing upwards
Furthermore, the Descending Channel that I originally marked out on the Daily TF is still intact
And, with Price still pushing up to the Resistance
Additionally and on the H4 - I marked out and Ascending Channel with a Break-Out to the downside
And, over the trading week - The market continued to be bullish and retest the support of this channel.
Although, after testing this support - Price did fall slightly and pushed up again for a further test.
For me personally it was not at the confluence I was looking for to short the market
Following this, a further Ascending channel was identified
This providing similar confluence at the previously identified level of 1.252
So and again people - We are looking for the reaction at the 1.252 level of confluence.
Currently, I am on the side of sells - but, who knows, right?
Any for of Price Action in. for the a CS would be sells
Alternatively, a close above the 1.252 resistance zone I would consider Buys
As always - thanks for tuning in people
Keep it real!

GBPCHFHey traders, in this week we are monitoring GBPCHF for a selling opportunity around 1.25 zone, once we will receive any bearish confirmation the trade will be executed.
Trade safe, Joe.

gbpchfThis symbol has good conditions for sale due to Rivard risk
Stop Loss and Target are specified, respectively

GBPCHF ShortHey traders, in this week we are monitoring GBPCHF for a selling opportunity around 1.241 zone, once we will receive any bearish confirmation the trade will be executed.
Trade safe, Joe.

GBPCHF SetupGBPCHF is trading in a bearish parallel channel. Recently it has taken hit from the channel top and price drops sharply. We are expecting bears to carry their momentum and price will reach the channel bottom ultemately.
Trade your levels accordingly.

GBPCHF I It Will Head Upward Welcome back! Here's an analysis of this pair!
** We may see a gradual rise in the coming days because it's on an uptrend. The first wave or "push" has been completed, followed by a correction, and we next target would be 2595 zone (previous resistance), followed by 2665 resistance.
We recommend that you keep this pair on your watchlist and enter when the entry criteria of your strategy is met.
Please support this idea with a LIKE if you find it useful and Click "Follow" on our profile if you'd like these trade ideas delivered straight to your email in the future.
Thanks for your continued support!
Brian & Kenya Horton, BK Forex Academy

[14/1/22] GBPCHF Bearish biasPAIR IN FOCUS: GBPCHF
BIAS: BEARISH / SHORT
Price broke the rising trend line and also a support zone. Price retraced and retested the zone, could head for another leg lower.

Long GBPCHFStrong bullish trend with a retracement, and a rejection to go lower. Expecting at least a TP at the previous high

GBPCHF BUY SCALP Welcome back! Here's an analysis of this pair!
COMMENT BELOW and let us know your thoughts or questions!
**GBPCHF setting up for Buy Scalp...
Enter when the entry criteria of your strategy is met.
Please support this idea with a LIKE if you find it useful and Click "Follow" on our profile if you'd like these trade ideas delivered straight to your email in the future.
Thanks for your continued support!
Brian & Kenya Horton, BK Forex Academy

GBPCHF ShortHey traders, in this week we are monitoring GBPCHF for a selling opportunity around 1.259 zone, Once we will receive any bearish confirmation the trade will be executed.
Trade safe, Joe.

GBPCHF on a triangle pattern 🦐GBPCHF on the 4h chart is trading between an ascending trendline and a daily resistance.
According to Plancton's strategy IF the price will break above and satisfy the ACADEMY rules we will set a nice long order.
--––
Follow the Shrimp 🦐
Keep in mind.
🟣 Purple structure -> Monthly structure.
🔴 Red structure -> Weekly structure.
🔵 Blue structure -> Daily structure.
🟡 Yellow structure -> 4h structure.
⚫️ Black structure -> <4h structure.
Here is the Plancton0618 technical analysis , please comment below if you have any question.
The ENTRY in the market will be taken only if the condition of the Plancton0618 strategy will trigger.

GBPCHF - In Trend Engulfing Long Setup 4HGBPCHF has formed a significant bullish engulfing that engulfed 3 previous candles and closed strongly above resistance.
The engulfing candle closed at 4am CST.
Price perfectly rejected the 61.8% fib level 3 times with a wick which confirms this setup.
SL set 3 pips below the engulfing candle low.
TP set at 3X risk.

GBPCHF Bearish Continuation |16th Dec 2021Price is abiding to the descending trendline resistance, signifying an overall bearish momentum. We can expect that price to potentially drop Pivot level in line with 100% Fibonacci projection and -27.2% Fibonacci extension towards take profit level in line with 127.2% Fibonacci projection and previous swing low. Our bearish bias is further supported by the stochastic indicator where the %K line is abiding to the descending trendline resistance.
Any opinions, news, research, analyses, prices, other information, or links to third-party sites contained on this website are provided on an "as-is" basis, as general market commentary, and do not constitute investment advice. The market commentary has not been prepared in accordance with legal requirements designed to promote the independence of investment research, and it is therefore not subject to any prohibition on dealing ahead of dissemination. Although this commentary is not produced by an independent source, FXCM takes all sufficient steps to eliminate or prevent any conflicts of interest arising out of the production and dissemination of this communication. The employees of FXCM commit to acting in the clients' best interests and represent their views without misleading, deceiving, or otherwise impairing the clients' ability to make informed investment decisions. For more information about the FXCM's internal organizational and administrative arrangements for the prevention of conflicts, please refer to the Firms' Managing Conflicts Policy. Please ensure that you read and understand our Full Disclaimer and Liability provision concerning the foregoing Information, which can be accessed on the website.

GBPCHF potential for dip! | 15 Dec 2021Prices are on bearish momentum. We see potential for a dip from our sell entry at 1.22377 in line with 78.6% and 61.8% Fibonacci retracement towards our Take Profit at 1.21853 in line with 61.8% and 78.2% Fibonacci retracement. Technical indicators are showing bearish momentum.
Any opinions, news, research, analyses, prices, other information, or links to third-party sites contained on this website are provided on an "as-is" basis, as general market commentary, and do not constitute investment advice. The market commentary has not been prepared in accordance with legal requirements designed to promote the independence of investment research, and it is therefore not subject to any prohibition on dealing ahead of dissemination. Although this commentary is not produced by an independent source, FXCM takes all sufficient steps to eliminate or prevent any conflicts of interest arising out of the production and dissemination of this communication. The employees of FXCM commit to acting in the clients' best interests and represent their views without misleading, deceiving, or otherwise impairing the clients' ability to make informed investment decisions. For more information about the FXCM's internal organizational and administrative arrangements for the prevention of conflicts, please refer to the Firms' Managing Conflicts Policy. Please ensure that you read and understand our Full Disclaimer and Liability provision concerning the foregoing Information, which can be accessed on the website.
