GBP/CHF: Bought at market price (nearly 40-pip trade)Hi guys,
The pair is showing some bullish momentum since this morning.
According to the ICHIMOKU CLOUD, it could potentially reach the next untested resistance in the next hours.
The Lagging Span on the hourly chart has no real obstacle and the 15-min chart is showing bullish signs as well (price above the cloud, Lagging Span above the price, future KUMO green = bullish).
The R/R is slightly above 2 for this trade.
Trade with care,
Jesse
GBP-CHF

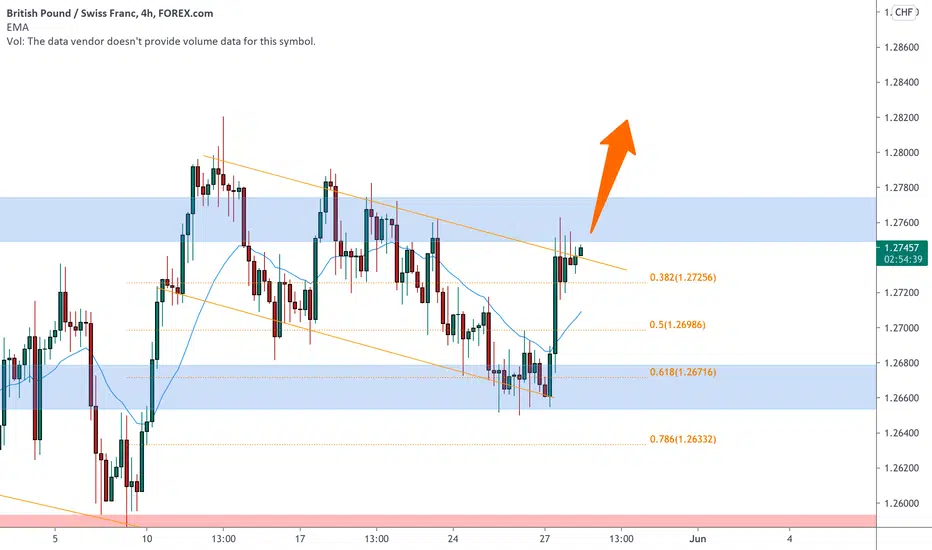
GBPCHF a turn at the 0.618 🦐GBPCHF after the recent impulse created a slow retracement inside a descending channel .
The price touches the 0.618 Fibonacci level and is now testing the upper trendline.
According to Plancton's strategy if the price will break above we will set a nice long order.
--––
Follow the Shrimp 🦐
Keep in mind.
🟣 Purple structure -> Monthly structure.
🔴 Red structure -> Weekly structure.
🔵 Blue structure -> Daily structure.
🟡 Yellow structure -> 4h structure.
⚫️ Black structure -> <4h structure.
Here is the Plancton0618 technical analysis , please comment below if you have any question.
The ENTRY in the market will be taken only if the condition of the Plancton0618 strategy will trigger.

Short GBPCHFHello, my fellow traders hope you all are making some profits. We are here with our new analysis so that we can increase those profits for you. Let’s get into it.
As we can see, the price is inside Channel and now started falling from its RESISTANCE. Its also broke its TRENDLINE SUPPORT.
Let us know your views on this in the comment section. Thank you all.
There is good news for our followers. We will be analyzing on-demand.
So let us know which pair you want our analysis on, and we will get it for you. Do like and follow us.

GBP CHF BUY (POUND STERLING - SWISS FRANC)Hi there.
Price is forming a continuation patternto the upside on lower time frame.
Wait for the price to complete the pattern and watch strong price action for buy.

GBPCHF a turn at the 0.618 🦐GBPCHF after the recent impulse created a slow retracement inside a descending channel.
The price touches the 0.618 Fibonacci level and is now testing the upper trendline.
According to Plancton's strategy if the price will break above we will set a nice long order.
--––
Follow the Shrimp 🦐
Keep in mind.
🟣 Purple structure -> Monthly structure.
🔴 Red structure -> Weekly structure.
🔵 Blue structure -> Daily structure.
🟡 Yellow structure -> 4h structure.
⚫️ Black structure -> <4h structure.
Here is the Plancton0618 technical analysis , please comment below if you have any question.
The ENTRY in the market will be taken only if the condition of the Plancton0618 strategy will trigger.
BUY in GBPCHFHello, my fellow traders hope you all are making some profits. We are here with our new analysis so that we can increase those profits for you. Let’s get into it.
As we can see, the price broke from its DESCENDING CHANNEL. One can go long .
Let us know your views on this in the comment section. Thank you all.
There is good news for our followers. We will be analyzing on-demand.
So let us know which pair you want our analysis on, and we will get it for you. Do like and follow us.

GbpChf LongGbpchf has break trendline, we have to wait for one retest on 61.8 (fibo) and go buy.
Long price: 1.2690
Stop Loss: 1.2670
Take profit: 1.2810
Risk 1:6

GBFCHF Reversed Head & Shoulder and go up My advisor Marketmiracle generated a LONG signal on GBPCHF with a target of 1,2854
Although the previous signal has not yet given the expected results of this fact and this fact is a confirmation of the previous, analyzing the graph it would seem that even the premises of basic technical analysis are there.
The price seems to draw an upside down head and shoulders, is close to the previous lower support and is about to cross a dynamic support of much longer period.
If this is not enough, the moving average at 200 periods is immediately below the price.
As far as cash flows are concerned, these are increasingly being supported by large investors in favour of the GBP appreciation.
Let’s see if even this time the price will continue to fall.. I think not.


GBP CHF BUY (POUND STERLING - SWISS FRANC)Hi there.
Price is forming a continuation pattern to the upside.
Wait for the price to complete the pattern and watch strong price action for buy.

GBPCHF facing bearish pressure, potential for further downside!Prices are facing bearish pressure from 1st resistance in line with 61.8% Fibonacci retracement and 61.8% Fibonacci extension. Prices might push down towards horizontal swing low support in line with -27.2% Fibonacci retracement and 100% Fibonacci extension. If prices push up further, prices might face resistance from horizontal swing high resistance in line with 100% Fibonacci extension. EMA is also above prices, showing a bearish pressure for prices.

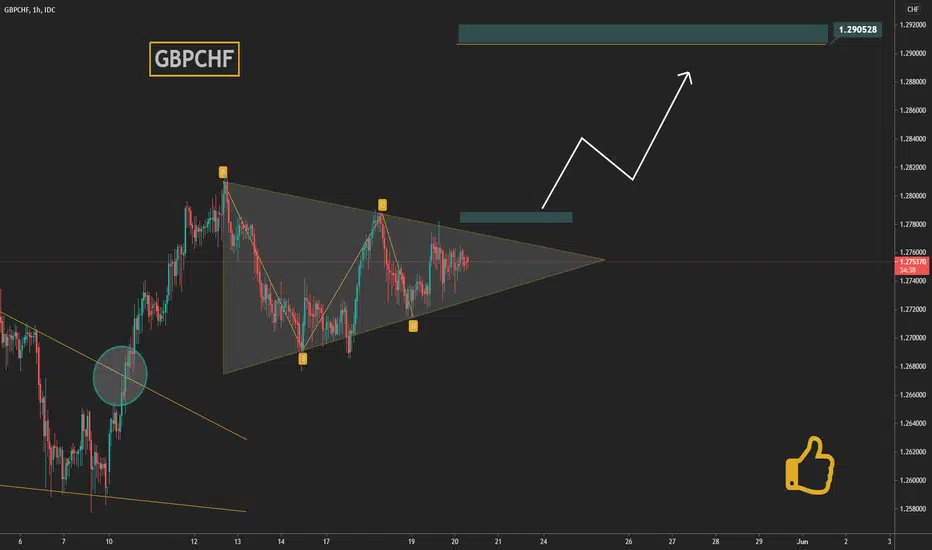
Triangle pattern on GBPCHFIn the beginning of the month GBPCHF managed to breakout of it's downtrend.
Now we see lower highs and higher lows, which closes price action inside of a triangle pattern.
We are now waiting for a breakout and an upside move.
A confirmed breakout would be price closing above previous high, and then we can see price reaching 1,2900!
Any entries before that are and unreasonable
GBPCHF continues with his ascentMy Marketmiracle advisor generated a LONG input signal for GBPCHF
Looking at the graph effectively the situation is compatible with the forecast of the advisor, GBP will continue in my opinion to appreciate, bounce on the trendline until to break the support and to climb until the double that is until 1,2845 approximately.
The market sentiment is just negative and at this level will certainly not put in trouble the ascent.
This idea is based on a signal generated by the advisor Marketmiracle, down on this page you will find the link to the page of signals of the advisor that you can see for free without any cost or registration

GBPCHF Long OpportunityPotential long opportunity on GBPCHF Like it shows on the chart , keep it nice and clean

GBPCHF ANALYSISGBPCHF rebounded from resistance level at 1.2805 after forming false breakout
MACD shows start of bearish momentum
It's expected for coming correction to target HVN at level 1.2703
then finally target support level at 1.2590

GBP/CHF: RANGE AREA WITH BEARISH PATTERN - SHORT SETUP 🔥 🔔Welcome back Traders, Investors, and Community!
If you LIKE this analysis, Please support our page by hitting the LIKE 👍 button
Traders, if you like this idea or have your own opinion about it, please write your own in the comment box . We will be glad for this.
Have a Good trading day!


GBP/CHF : PRICE ACTION IN DAILY TMF - PRICE IS GROWING ! ! ! 🔔Hello Everyone, I hope you'll Appreciate our Advanced Analysis on Price Action !
Check the Link on BIO and If you LIKE this analysis, Please support our page by hitting the LIKE👍 button
Feel free to request any pair/instrument analysis or ask any questions in the comment section below.
If you like this idea or have your own opinion about it, please write your own in the comment box . We will be glad for this.
Have a Good Take Profits !


GBPCHF on a bullish move 🦐GBPCHF after the recent low started a bullish impulse.
The market is now testing the upper trendline of a descending channel and according to Plancton's strategy if the price will break above we can set a nice long order.
--––
Follow the Shrimp 🦐
Keep in mind.
🟣 Purple structure -> Monthly structure.
🔴 Red structure -> Weekly structure.
🔵 Blue structure -> Daily structure.
🟡 Yellow structure -> 4h structure.
⚫️ Black structure -> <4h structure.
Here is the Plancton0618 technical analysis , please comment below if you have any question.
The ENTRY in the market will be taken only if the condition of the Plancton0618 strategy will trigger.
Leave a comment that is helpful or encouraging. Let's master the markets together

GBP CHF BUY (POUND STERLING - SWISS FRANC)Hi there.
Price is forming a reversal pattern to change its direction.
Watch strong price action at the current levels for buy.

GBPCHF will test the weekly support? 🦐GBPCHF on the 4h chart is moving inside a descending channel.
The market is testing now the support area at 1.25900 and according to Plancton's strategy if the price will break below we will set a nice short order.
--––
Follow the Shrimp 🦐
Keep in mind.
🟣 Purple structure -> Monthly structure.
🔴 Red structure -> Weekly structure.
🔵 Blue structure -> Daily structure.
🟡 Yellow structure -> 4h structure.
⚫️ Black structure -> <4h structure.
Here is the Plancton0618 technical analysis , please comment below if you have any question.
The ENTRY in the market will be taken only if the condition of the Plancton0618 strategy will trigger.
Leave a comment that is helpful or encouraging. Let's master the markets together

GBPCHF a bear trap 🦐GBPCHF after a few tests of the support area attempt to break below creating a bear trap with a false breakout.
The price is now moving in a bullish price action and according to Plancton's strategy if the market will break above the resistance area we will set a nice long order according to Plancton's strategy.
--––
Follow the Shrimp 🦐
Keep in mind.
🟣 Purple structure -> Monthly structure.
🔴 Red structure -> Weekly structure.
🔵 Blue structure -> Daily structure.
🟡 Yellow structure -> 4h structure.
⚫️ Black structure -> <4h structure.
Here is the Plancton0618 technical analysis , please comment below if you have any question.
The ENTRY in the market will be taken only if the condition of the Plancton0618 strategy will trigger.
