GBPJPY SHORT TO 149📉 (2,000+ PIPS OPPORTUNITY!)GJ is getting ready to take a huge dive down towards 150-148, leading into the coming summer. This is offering us a huge swing opportunity of 2,000 PIPS, for those who are patient enough to hold on long term. The 2D TF is attached below.
Selling Confluences:
🚫5 Wave Impulse Move Complete.
🚫Corrective Move Yet to Follow.
🚫Buying Momentum Choppy.
🚫Buying LQ Already Taken.
Drop a like/follow and let me know what you think✅
Gbp-jpy

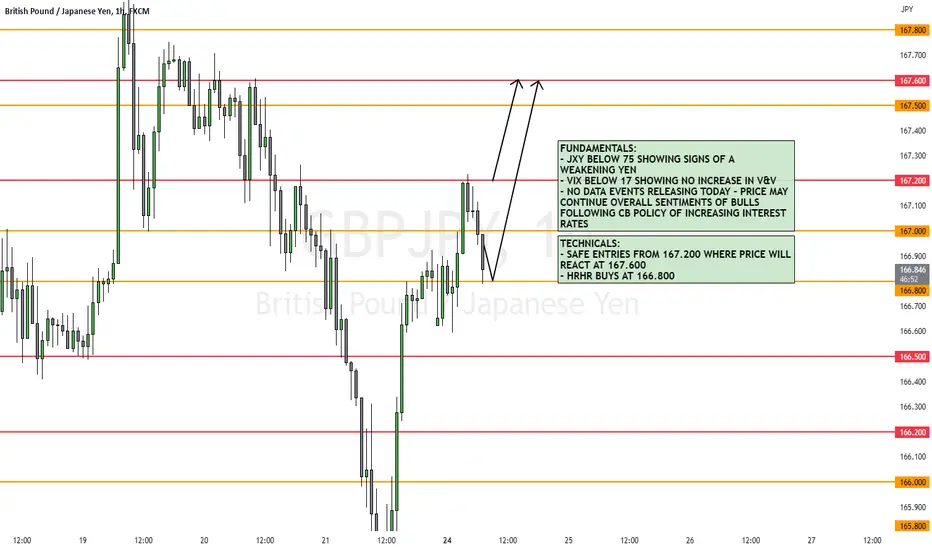
GBPJPY 24/04/2023Details on chart - looking to see continuation buys on GJ to further support the main narrative
GBPJPY Potential DownsidesHey Traders, in tomorrow's trading session we are monitoring GBPJPY for a selling opportunity around 167 zone, GBPJPY was trading in a downtrend and successfully managed to break it out and now seems to be in a correction phase in which it is approaching the retrace zone, so we will be watching a potential reversal from 167 resistance area.
Trade safe, Joe.


GBPJPY Outlook 21 April 2023The GBPJPY reversed strongly from the 168.00 resistance area, with the price now having broken the support-turned-resistance level of 166.60.
In addition, the price has closed below the 61.80% Fibonacci retracement level from the longer term.
Further downside could be expected with the next key support level at 165.40. However, the 166.00 round number level could provide brief support for the downward move.
This move to the downside is likely to be driven by both the weakness in the GBPUSD and potentially from further downside on the USDJPY.

GBPJPY - Potential Bearish Reversal ↘️Hello TradingView Family / Fellow Traders. This is Richard, also known as theSignalyst.
on DAILY: Left Chart
As per my last analysis, we know that GBPJPY is approaching a strong daily resistance, so we will be looking for sell setups on lower timeframes.
on H1: Right Chart
GBPJPY is formed a channel in red but it is not ready to go yet.
🏹 For the bears to take over, we need a momentum candle close below the last major low in gray.
Meanwhile, until the sell is activated, GBPJPY can still trade higher and even break the resistance upward.
📚 Always follow your trading plan regarding entry, risk management, and trade management.
Good luck!
All Strategies Are Good; If Managed Properly!
~Rich

GBPJPY 20/04/2023Details on chart - looking to see continuation of the HTF bias however, understanding slight pullbacks in price to gather more orders to then continue up is also valid

GBPJPY - Checkpoint Ahead ✅Hello TradingView Family / Fellow Traders. This is Richard, also known as theSignalyst.
GBPJPY has been trading in range between our blue/green support and resistance zones.
Lately, from a medium-term perspective, GBPJPY has been bullish trading inside the rising broadening wedge pattern and it is currently approaching the upper red trendline.
Moreover, the blue zone 169.0 is a strong resistance.
🏹 So the highlighted purple circle is a strong area to look for sell setups as it is the intersection of the blue resistance and upper red trendline. (acting as non-horizontal resistance)
As per my trading style:
As GBPJPY approaches the upper purple circle zone, I will be looking for bearish reversal setups (like a double top pattern, trendline break , and so on...)
📚 Always follow your trading plan regarding entry, risk management, and trade management.
Good luck!
All Strategies Are Good; If Managed Properly!
~Rich

GBPJPY 19/04/2023Details on chart - looking to see continuation of buys on GBPJPY as inflation remains high, BOE still have work to do

GBPJPY 18/04/2023Details on chart - looking to see continued buys from PPL's to continue the HTF bias

GBPJPY: Channel Up needing a pull backThe GBPJPY pair has been trading inside a Channel Up pattern for the majority of the year and with the price now on its top, the 1D technicals are naturally bullish (RSI = 65.660, MACD = 1.070, ADX = 50.539).
A Golden Cross will be formed by next week and just as the Death Cross was on a bottom on Jan 17th, the Golden Cross can be the Channel's new Higher High and start a pull back to its bottom. Sell as long as the price closes inside the Channel Up and buy near the bottom (TP = 168.000).
Prior idea:
## If you like our free content follow our profile to get more daily ideas. ##
## Comments and likes are greatly appreciated. ##

GBPJPY 17/04/2023Details on chart - looking to continue the bullish bias on GJ and continue printing new highs

GBPJPY trend reversal GBPJPY
here we have a markup showing the last shifts from this pair, now we have shifted away from our last buy range formed we have a clue that we could be getting ready for a short move on GJ. just because we have this shift in ranges does not mean we are 100% going to bearish, so we will only be looking to take a confirmation sell from the supply zone highlighted above.
following our order flow back and tracking the volumes is showing sell side coming in strongest we have had in this current trend to date.
of course we will see how price plays out before hitting our zone if it does get back there!
We'll be closely monitoring market openings and price action throughout the week. If you find this analysis useful, let us know in the comments below and hit the boost button to show your support. Here's to a successful week of trading!

GBPJPY - NY Friday Mid day Shorts.GBPJPY
Liquidity has been taken from the Asian session and we now have some bearish price action.
I am anticipating an entry at 166.038, with a SL at 166.226
It is Friday NY session past mid day so the chances that this takes place are low.
Below i will attach 2MIN chart with refined entries

GBPJPY | Bullish Signal!The GBP/JPY pair appears to be on an upward trajectory, with a bullish sentiment prevailing in the market. This can be attributed to a number of macroeconomic factors, such as the increasing demand for British goods and services, improving economic conditions in the UK, and the recent monetary policy decisions taken by the Bank of England.
Furthermore, technical analysis indicates a bullish trend as the pair has recently experienced a MA crossover, with the shorter-term moving average crossing above the longer-term moving average. This crossover suggests that momentum is building in favor of the bulls, and that a potential uptrend may be on the horizon.
Overall, while it's important to keep an eye on any developments that may impact the pair, the current market sentiment for GBP/JPY is bullish, and traders may want to consider taking long positions in the pair.


Gbpgpy after result running 300 pipshello traders i have posted a signal Gbpjpy expected retracement to a poi and a bullish movement let me know if you was in this trade i have posted for this week check it out it might help you wish you good luck and good trading week


GBPJPY Last push upwards before strong sell?The GBPJPY pair did give a good rebound and pull-back following our February 03 idea but hasn't yet touched the Symmetrical Support level:
However it did manage to form a solid Channel Up, closing above the old Higher Lows trend-line and rebounding on the 1D MA100 (red trend-line). As long as those hold, buy and target 168.000 right below the Symmetrical Resistance Zone. A 1D candle close below the Channel Up, would be a sell signal for us, targeting just above the Symmetrical Support level finally at 156.000.
-------------------------------------------------------------------------------
** Please LIKE 👍, FOLLOW ✅, SHARE 🙌 and COMMENT ✍ if you enjoy this idea! Also share your ideas and charts in the comments section below! **
-------------------------------------------------------------------------------
💸💸💸💸💸💸
👇 👇 👇 👇 👇 👇

GBPJPY | Bullish Signal! GBP/JPY has been showing signs of bullish momentum recently, approaching a key resistance level that could potentially trigger a breakout. The currency pair has formed several strong wicks in the past few days, indicating that there is strong buying pressure at lower levels.
Furthermore, the MACD indicator has crossed above the signal line, suggesting that the uptrend is gaining strength. The RSI indicator is also in the overbought territory, which further supports the bullish bias.
If GBP/JPY manages to break above the key resistance level, we could see a strong continuation of the uptrend, potentially targeting the next resistance level at . Traders who are looking to enter a long position may consider waiting for a confirmed breakout above the resistance level, and placing a stop loss below the recent swing low for risk management purposes.
Overall, the technical indicators are signaling a potential bullish move for GBP/JPY, and traders should keep a close eye on the currency pair in the coming days.

GBPJPY Potential DownsidesHey Traders, in the coming week we are monitoring GBPJPY for a selling opportunity around 164.5 zone, GBPJPY is trading in a bear pattern and now seems to be approaching an important support and resistance zone as mentioned in the chart. i would JPY longs setups as the Yen is considered a safe haven in time of uncertainties.
Trade safe, Joe.


GBPJPY Outlook 6th April 2023Read the USDJPY analysis and the GBPUSD analysis
Anticipating some brief upward move on the USDJPY (before a continuation to the downside) and a continuation of the upward trend on the GBPUSD.
This could signal some upside potential for the GBPJPY as the price finds support along the 163 price level. The GBPJPY could climb to retest the 166 resistance level briefly.
However, watchout for the potential hesitation level at the 164.50 price level which coincides with the 50% fib level in the shorter term.
