GBPJPY LONG BIAS! (UPDATED)Hello all!
Like Projected last week on GJ! Pair MITIGATED my POI shared from last time and moved up towards 166!
I will look to find a new entry for a LONG position when something presents on LTF! For now the Hourly trendline is super BULLISH..
So, safest option is waiting for a POI then monitoring it correctly before executing..
Take care!
Gbp-jpy

GBPJPY - Video Top-Down Analysis!Hello TradingView Family / Fellow Traders. This is Richard, as known as theSignalyst.
Here is a detailed update top-down analysis for GBPJPY.
Which scenario do you think is more likely to happen? and Why?
Always follow your trading plan regarding entry, risk management, and trade management.
Good Luck!.
All Strategies Are Good; If Managed Properly!
~Rich

GbpJpy - Manipulation Point Trading Bias: Long
Market Cycle: 2
Yesterdays analysis has proven to be correct even if we didn't get a pullback and entry...
I'm looking for a pullback and entry from either 159.90 or 159.53 both KL's in terms of round number trading and valid manipulation points in our trading system.

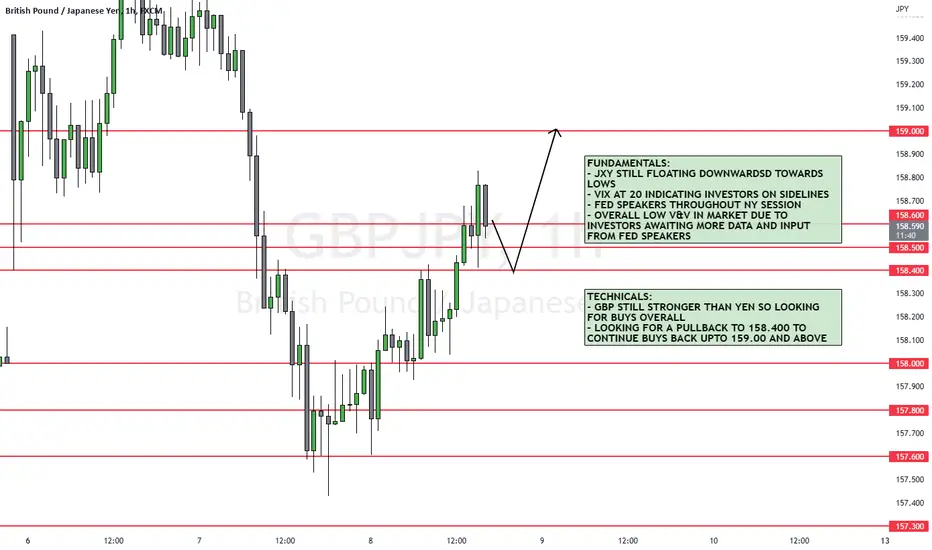
GBPJPY 14/02/2023Details on chart - looking for more buys ahead of a stronger Pound compared to the Yen

GBPJPY Potential for Bullish Rise towards overlap resistanceLooking at the H4 chart, my overall bias for GBPJPY is bullish due to the current price being above the Ichimoku cloud, indicating a bullish market. Looking for a pullback buy entry at 159.436, where the overlap support and 50% Fibonacci line is. Stop loss will be at 157.539, where the recent low is. Take profit will be at 164.350, where the overlap resistance and 61.8% Fibonacci line is.
Please be advised that the information presented on TradingView is provided to Vantage (‘Vantage Global Limited’, ‘we’) by a third-party provider (‘Everest Fortune Group’). Please be reminded that you are solely responsible for the trading decisions on your account. There is a very high degree of risk involved in trading. Any information and/or content is intended entirely for research, educational and informational purposes only and does not constitute investment or consultation advice or investment strategy. The information is not tailored to the investment needs of any specific person and therefore does not involve a consideration of any of the investment objectives, financial situation or needs of any viewer that may receive it. Kindly also note that past performance is not a reliable indicator of future results. Actual results may differ materially from those anticipated in forward-looking or past performance statements. We assume no liability as to the accuracy or completeness of any of the information and/or content provided herein and the Company cannot be held responsible for any omission, mistake nor for any loss or damage including without limitation to any loss of profit which may arise from reliance on any information supplied by Everest Fortune Group.

GBPJPY 13/02/2023Details on chart - looking for more buys ahead of a stronger Pound compared to the Yen

GBPJPY: This pair poised for a drop / BoJ Governor voteWe've seen recent strength from JPY in preparation for the announcement of a new Governor, with nominations expected in the next few days. The currency rose this past week when it was 'leaked' that Kazuo Ueda could become the next Governor, and this could lead to a change in monetary policy.
Anyone following me will note I'm weak on GBP and generally bullish on JPY in my ideas - I don't think BoE have room for hikes that can compete with other majors, BoJ do (and they seem to have managed their economy incredibly well post-pandemic).
BoJ certainly has room for manoeuvre, and I'm expecting strength from the yen this year. With inflation levels higher than target, interest rates low and potentially a new Governor that is no stranger to voting for monetary tightening when needed, the landscape is there for shorting the GBPJPY.
I think this pair is due a big drop, we may see the rise up to 164 to form a rising wedge, but my expectation is a fall before it reaches that point, and a big one at that.

GBPJPY 10/02/2023Details on chart - looking to see if a correction will occur after poor data for GBP, playing the HTF bullish bias

GBPJPY 09/02/2023Details on chart - looking for price to break out of range to continue overall bullish HTF bias

gbpjpy shorts while I can’t guarantee your success as a trader, I can guarantee that if you study and apply the mini-lessons below you will be in a much better position to succeed.

GBPJPY: Excellent sideways opportunityGBPJPY is bearish on the long term as it remains under the 1D MA50 (right chart) with technicals all in red (RSI = 41.765, MACD = -0.860, ADX = 25.857) despite trading within a range since the end of December.
This range is practically what we want right now as the sideways price action offers the best scalping opportunity for at least the next week. The price is approaching S1 where we will long to R1 and reverse to a short. Repeat until either the top of R1 and bottom of S1 break.
## If you like our free content follow our profile to get more daily ideas. ##
## Comments and likes are greatly appreciated. ##

GBPJPY LONG BIAS! (UPDATED!)Hello all!
GBPJPY Top-Down analysis recap..
I am BULLISH on GJ. Reason being is because pair is in low curve on HTF, and it broke the Monthly supply of 163 back in March. So, 184 is the next target for the near future.
On LTF, I am waiting for the POI (Marked in video) to mitigate, from there i will monitor 15 min TF and enter a LONG position!
Enjoy the video!
Take care :)


GBPJPY repricing taking placeGBPJPY has consolidated in the daily chart since the start of the year, following a steep decline in December. The price for GBPJPY keeps bouncing on the major area between 161.800 resistance and 156.300 support on the daily timeframe. There is also a minor consolidation between 161.800 and 160.600. This minor consolidation area is highlighted between the 50-EMA and 20-EMA periods.
Last week the break in the minor consolidation led to a downward move. A noticeable three-bearish candle pattern formed a three-black crow after the break of structure from the minor consolidation. This formation may signal a potential further move to the downside. However, before the week ended last week, the formation of minor support occurred at 157.300, following the pattern formation.
After the price created minor support at 157.300, the price recovered about half of its loss after the breakout at the minor consolidation area. It may tap at 160.600 or the 20-EMA period for a possible retest before a rejection happen. It is also worth noting that the weekly candle does not have a bottom wick which can be considered a Marubozu open. This type of candle could mean that the bulls are in control at the moment, and the price keeps moving without falling, which supports that we may have enough strength for a retest. On the other hand, some believe that a candle without a wick will eventually form one, either at the top or bottom. This could mean that after a retest, there is a possibility of a downward move to create a bottom wick. Historically, a candle closes without a wick is rarely seen in the forex market.
Since GBPJPY is technically in a consolidation period in general, it is hard to say that the current downtrend will continue. But the signal given by the three-black crow formation may hold if the price found itself breaking below this major daily consolidation area between 161.800 and 156.300.
In conclusion, GBPJPY has been consolidating between the price range of 161.800 to 156.300 since the start of the year. A recent minor consolidation between 161.800 and 160.600 was broken, leading to a downward move which created the three-black crow pattern. However, the creation of minor support at 157.300 allowed the price to recover half of its losses. A possible retest at 160.600 or the 20-EMA period is possible, but it is uncertain whether the downtrend will continue. The current trend and the signals given by the three-black crow formation will depend on whether the price breaks below the major daily consolidation area between 161.800 and 156.300.


A new Bearish setup on GBP/JPYTaking the divergence, almost triple top patterns into consideration, the market has left us with a plausible bearish cause to decide upon, knowing well that the price is still trending above the trendline.
For a bearish setup to be strongly confirmed, price needs to break below the trendline and also break the previous low (BOS).
Alternatively, if the price happen to break the supply zone, then the bullish run could be targeted towards 164.10.
Watch out.

GBPJPY Key Support Zone GBPJPY Has retested off the key support zone again to create the end of a triple bottom that we previously saw break out bearish but with last weeks positive news for GBP and the downward trend of the JPY add confluence to the pivot point and we could see prices rise, that being said amidst the gloomy outlook on the undecided interest rates in the UK it would be wise to see how we react after market open going into next week and if we continue bearish to retest the support or break through.

GBPJPY BUY ZONEGood evening everyone! Don't forget to put your thumbs up and write comment if you like the idea.
GBPJPY buy zone 157.100 and 155.800 and 154.700 SL 154.00. Risk 1%. Buy from monthly and weekly target area. First Target Standard, Global Target Return to Area 161.900 and 165.100
DISCLAIMER:
The opinion of the author may not coincide with yours! Keep this in mind and consider in your trading transactions before making a trading decision.

GBPJPY a test of the 50% Fibonacci level 🦐The GBP/JPY currency pair, on the 4-hour timeframe, is currently trading within a range between the recent low and the daily 50% Fibonacci level.
The market saw a drop from its previous high, but it has now stabilized within this range.
This range-bound behavior can indicate indecision among market participants and a potential lack of clear direction. Traders may be watching key technical levels, such as the 50% Fibonacci level and the recent low, for signs of a potential break out.
The price is also testing the 50% of the range and in the event of a break above the 50% Fibonacci level, it could indicate bullish momentum and a potential rise in price. On the other hand, according to Plancton's strategy a break below the recent low could signal bearish momentum and a potential decrease in price.

GBPJPY Bearish as long as it's below the 1D MA50.The GBPJPY pair has been trading below its 1D MA50 (blue trend-line) since December 16 2022. With a 1D Golden Cross having formed on January 17, the price is about to test for the 3rd time in a month the 155.770 - 155.400 Symmetrical Support Zone. A break below it would target the dotted line (multi-year Channel Up bottom) and below that the 148.800 Support which has held 5 times since the March 2021 Low.
On the other hand if the Symmetrical Support holds, it will make a Triple bottom and it will be a short-term buy opportunity towards the 1D MA50. Any time that breaks, it will extend the rebound above 166.00, which based on the Symmetrical pattern since May 2022, it will be the most optimal long-term sell opportunity.
-------------------------------------------------------------------------------
** Please LIKE 👍, FOLLOW ✅, SHARE 🙌 and COMMENT ✍ if you enjoy this idea! Also share your ideas and charts in the comments section below! **
-------------------------------------------------------------------------------
💸💸💸💸💸💸
👇 👇 👇 👇 👇 👇

GBP/JPY NFP 03- 04/02/2023 Possible drop too 155.500 to see if the market will break or pull, considering there is nfp new tonight expecting the drop to continute to 149.000 to wick that demand zone and continue bullish....
banks will take out buy orders at 155.500 stop hunt the orders/ I personally think tonight will have a lot of manipulations for people to buy and get stopped out till NFP news comes out with a finally bearish wick to 149.000 as done previously before the bullish movement let me know what you think .. good luck tonight lets get it $$$$

SELL ANALYSIS ON GBPJPYPrice has failed to break the resistance zone multiple times since 2022. price is at the zone again and we can see the change in market structure to a bearish one which shows us reversal. We can also see a breakout of trend line which also helps us confirm that GBPJPY will be bearish. So we have 3 confirmations now which are failure to break resistance zone, change in market structure, break of trendline. We set our SL just right above the resistance zone. TP1 is at the first support zone at 158 and TP2 is the final take profit at 155 with a risk to reward ratio of 7:1. Risk wisely
