Bullish bounce?GBP/USD is falling towards the support level which is an overlap support and could bounce from this level to our take profit.
Entry: 1.2865
Why we like it:
There is an overlap support level.
Stop loss: 1.2803
Why we like it:
There is an overlap support level that is slightly above the 127.2% Fibonacci extension.
Take profit: 1.2936
Why we like it:
There is a pullback resistance level.
Enjoying your TradingView experience? Review us!
Please be advised that the information presented on TradingView is provided to Vantage (‘Vantage Global Limited’, ‘we’) by a third-party provider (‘Everest Fortune Group’). Please be reminded that you are solely responsible for the trading decisions on your account. There is a very high degree of risk involved in trading. Any information and/or content is intended entirely for research, educational and informational purposes only and does not constitute investment or consultation advice or investment strategy. The information is not tailored to the investment needs of any specific person and therefore does not involve a consideration of any of the investment objectives, financial situation or needs of any viewer that may receive it. Kindly also note that past performance is not a reliable indicator of future results. Actual results may differ materially from those anticipated in forward-looking or past performance statements. We assume no liability as to the accuracy or completeness of any of the information and/or content provided herein and the Company cannot be held responsible for any omission, mistake nor for any loss or damage including without limitation to any loss of profit which may arise from reliance on any information supplied by Everest Fortune Group.
Gbp-usd

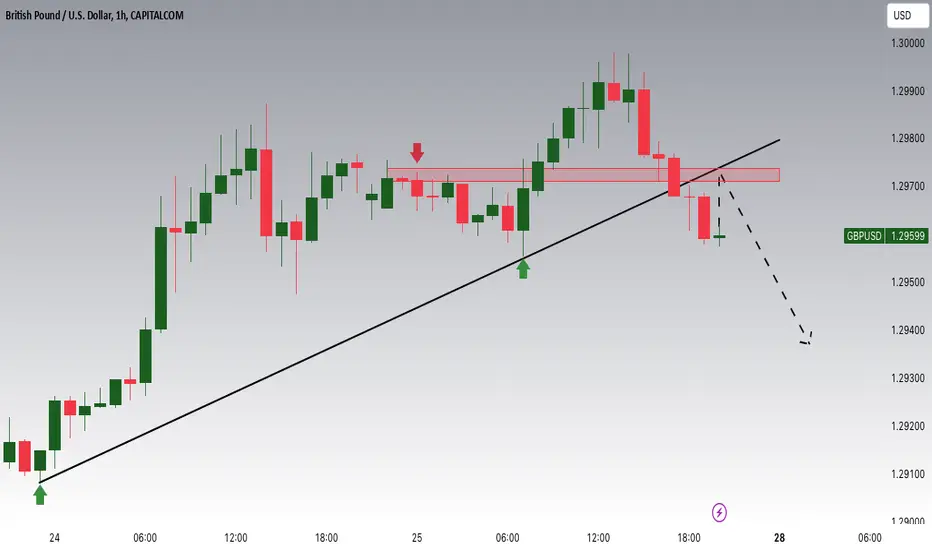
GBPUSD Potential DownsidesHey Traders, in today's trading session we are monitoring GBPUSD for a selling opportunity around 1.29800 zone, GBPUSD is trading in a downtrend and currently is in a correction phase in which it is approaching the trend at 1.29800 support and resistance area.
Trade safe, Joe.

GPBUSD Bearish Megaphone starting new wave.GBPUSD is trading inside a Bearish Megaphone for the past 30 trading days.
The price may now be supported by the 1hour MA50 but has formed the bearish formation it had on all prior tops under the Falling Resistance.
The 1hour RSI has formed a similar topping pattern.
As a result, this is a standard sell signal for the Bearish Megaphone.
All declines reached the 1.5 Fibonacci extension, so we can target at least the previous Low at 1.2850.
Follow us, like the idea and leave a comment below!!

Bearish reversal off pullback resistance?The Cable (GBP/USD) is rising towards the pivot which has been identified as a pullback resistance and could reverse to the 1st support level which is a pullback support.
Pivot: 1.3022
1st Support: 1.2909
1st Resistance: 1.3105
Risk Warning:
Trading Forex and CFDs carries a high level of risk to your capital and you should only trade with money you can afford to lose. Trading Forex and CFDs may not be suitable for all investors, so please ensure that you fully understand the risks involved and seek independent advice if necessary.
Disclaimer:
The above opinions given constitute general market commentary, and do not constitute the opinion or advice of IC Markets or any form of personal or investment advice.
Any opinions, news, research, analyses, prices, other information, or links to third-party sites contained on this website are provided on an "as-is" basis, are intended only to be informative, is not an advice nor a recommendation, nor research, or a record of our trading prices, or an offer of, or solicitation for a transaction in any financial instrument and thus should not be treated as such. The information provided does not involve any specific investment objectives, financial situation and needs of any specific person who may receive it. Please be aware, that past performance is not a reliable indicator of future performance and/or results. Past Performance or Forward-looking scenarios based upon the reasonable beliefs of the third-party provider are not a guarantee of future performance. Actual results may differ materially from those anticipated in forward-looking or past performance statements. IC Markets makes no representation or warranty and assumes no liability as to the accuracy or completeness of the information provided, nor any loss arising from any investment based on a recommendation, forecast or any information supplied by any third-party.

GBPUSD Breakout And Potential RetraceHey Traders, in the coming week we are monitoring GBPUSD for a selling opportunity around 1.29300 zone, GBPUSD was trading in an uptrend and successfully managed to break it out. Currently is in a correction phase in which it is approaching the retrace area at 1.29300 support and resistance zone.
Trade safe, Joe.

GU could be getting ready to Reverse!Now that we are in a new month AND its election week next week the market could get very volatile. Dollar has been moving bearish all week and most are still expecting it to move bullish. I'm thinking its more likely to turn bullish for a little while. Leaving the Election news to give it the bullish push it needs to start pushing back up. This could lead to some significant moves in the market. We just have to remain ready!
Yall Lock in and follow me you Youtube #NOFOMO is the channel!
www.youtube.com

Falling towards pullback support?The Cable (GBP/USD)n is falling towards the pivot and could bounce to the 1st resistance which has been identified as a pullback resistance.
Pivot: 1.2908
1st Support: 1.2866
1st Resistance: 1.3024
Risk Warning:
Trading Forex and CFDs carries a high level of risk to your capital and you should only trade with money you can afford to lose. Trading Forex and CFDs may not be suitable for all investors, so please ensure that you fully understand the risks involved and seek independent advice if necessary.
Disclaimer:
The above opinions given constitute general market commentary, and do not constitute the opinion or advice of IC Markets or any form of personal or investment advice.
Any opinions, news, research, analyses, prices, other information, or links to third-party sites contained on this website are provided on an "as-is" basis, are intended only to be informative, is not an advice nor a recommendation, nor research, or a record of our trading prices, or an offer of, or solicitation for a transaction in any financial instrument and thus should not be treated as such. The information provided does not involve any specific investment objectives, financial situation and needs of any specific person who may receive it. Please be aware, that past performance is not a reliable indicator of future performance and/or results. Past Performance or Forward-looking scenarios based upon the reasonable beliefs of the third-party provider are not a guarantee of future performance. Actual results may differ materially from those anticipated in forward-looking or past performance statements. IC Markets makes no representation or warranty and assumes no liability as to the accuracy or completeness of the information provided, nor any loss arising from any investment based on a recommendation, forecast or any information supplied by any third-party.

GU is volatile...but we need more data for direction...I cant really call it at the moment. Price is indecisive as we come to the monthly transition. The last day of the month and anything can happen. Watching for a solid direction and sitting on hands for now until London open. Expecting some good price action for both sessions going into Thursday.

GBPUSD Channel Up emerging. Short term buy.GBPUSD recently broke to the upside the former Channel Down of October and a Channel Up emerged from it.
It already formed a Golden Cross (1h) today, technically a very bullish pattern.
Trading Plan:
1. Buy on the current market price.
Targets:
1. 1.3035 (top of Channel Up)
Tips:
1. The RSI (4h) is on low enough levels again to justify a technical buy.
Please like, follow and comment!!

GU look like it setting up for a nice entry for London sessionI been looking for a solid sell entry to continue the bearish trend that GU has been in. The dollar failed to break out and is now retracing to grab more liquidity to push up. in turn giving us a nice entry for a sale. We have to be patient and allow price to find its resistance levels. Expecting a nice set up for London.

Potential bullish rise?GBP/USD has reacted off the support level which is a pullback support that aligns with the 23.6% Fibonacci retracement and could rise from this level to our take profit.
Entry: 1.3000
Why we like it:
There is a pullback support level that lines up with the 23.6% Fibonacci retracement.
Stop loss: 1.2976
Why we like it:
There is a pullback support level that lines up with the 61.8% Fibonacci retracement.
Take profit: 1.3053
Why we like it:
There is a pullback resistance level.
Enjoying your TradingView experience? Review us!
Please be advised that the information presented on TradingView is provided to Vantage (‘Vantage Global Limited’, ‘we’) by a third-party provider (‘Everest Fortune Group’). Please be reminded that you are solely responsible for the trading decisions on your account. There is a very high degree of risk involved in trading. Any information and/or content is intended entirely for research, educational and informational purposes only and does not constitute investment or consultation advice or investment strategy. The information is not tailored to the investment needs of any specific person and therefore does not involve a consideration of any of the investment objectives, financial situation or needs of any viewer that may receive it. Kindly also note that past performance is not a reliable indicator of future results. Actual results may differ materially from those anticipated in forward-looking or past performance statements. We assume no liability as to the accuracy or completeness of any of the information and/or content provided herein and the Company cannot be held responsible for any omission, mistake nor for any loss or damage including without limitation to any loss of profit which may arise from reliance on any information supplied by Everest Fortune Group.

Bearish drop?The Cable (GBP/USD) has reacted off the pivot which has been identified as a pullback resistance and could srop to the 1st support which acts as a pullback support.
Pivot: 1.2989
1st Support: 1.2915
1st Resistance: 1.3033
Risk Warning:
Trading Forex and CFDs carries a high level of risk to your capital and you should only trade with money you can afford to lose. Trading Forex and CFDs may not be suitable for all investors, so please ensure that you fully understand the risks involved and seek independent advice if necessary.
Disclaimer:
The above opinions given constitute general market commentary, and do not constitute the opinion or advice of IC Markets or any form of personal or investment advice.
Any opinions, news, research, analyses, prices, other information, or links to third-party sites contained on this website are provided on an "as-is" basis, are intended only to be informative, is not an advice nor a recommendation, nor research, or a record of our trading prices, or an offer of, or solicitation for a transaction in any financial instrument and thus should not be treated as such. The information provided does not involve any specific investment objectives, financial situation and needs of any specific person who may receive it. Please be aware, that past performance is not a reliable indicator of future performance and/or results. Past Performance or Forward-looking scenarios based upon the reasonable beliefs of the third-party provider are not a guarantee of future performance. Actual results may differ materially from those anticipated in forward-looking or past performance statements. IC Markets makes no representation or warranty and assumes no liability as to the accuracy or completeness of the information provided, nor any loss arising from any investment based on a recommendation, forecast or any information supplied by any third-party.

GU Can go either way! We need more data before we have a direction this week. The dollar is definitely bullish for the most part so being patient and waiting for a good sale entry might be the best bet.

Bearish drop?GBP/USD has reacted off the resistance level which is a pullback resistance that aligns with the 50% Fibonacci retracement and could drop from this level to our take profit.
Entry: 1.3000
Why we like it:
There is a pullback resistance level that lines up with the 50% Fibonacci retracement.
Stop loss: 1.3071
Why we like it:
There is a pullback resistance level.
Take profit: 1.2872
Why we like it:
There is a pullback support level that aligns with the 127.2% Fibonacci extension.
Enjoying your TradingView experience? Review us!
Please be advised that the information presented on TradingView is provided to Vantage (‘Vantage Global Limited’, ‘we’) by a third-party provider (‘Everest Fortune Group’). Please be reminded that you are solely responsible for the trading decisions on your account. There is a very high degree of risk involved in trading. Any information and/or content is intended entirely for research, educational and informational purposes only and does not constitute investment or consultation advice or investment strategy. The information is not tailored to the investment needs of any specific person and therefore does not involve a consideration of any of the investment objectives, financial situation or needs of any viewer that may receive it. Kindly also note that past performance is not a reliable indicator of future results. Actual results may differ materially from those anticipated in forward-looking or past performance statements. We assume no liability as to the accuracy or completeness of any of the information and/or content provided herein and the Company cannot be held responsible for any omission, mistake nor for any loss or damage including without limitation to any loss of profit which may arise from reliance on any information supplied by Everest Fortune Group.

GBPUSD Breakout And Potential RetraceHey Traders, in today's trading session we are monitoring GBPUSD for a selling opportunity around 1.29750 zone, GBPUSD was trading in an uptrend and successfully managed to break it out. Currently is in a correction phase in which it is approaching the retrace area at 1.29750 support and resistance area.
Trade safe, Joe.
THE US DOLLAR is still King?The US Dollar Index has found support near all that former resistance from the past decade. The polarity here in the US Dollar is very real.

EUR | USD | GBP Weekly Forecast Oct. 28: SELL EU & GU!In this video, we will view the markets through ICT Concepts, focusing on the USD, the EURO, and the GBP.
The retracement in the USD Index is overdue and pending... but not yet! There is still room to the upside, which means EURUSD and GBPUSD will likely be BEARISH, as the USD is stronger than both at this time.
Look for the FVGs to hold price or fail, and let them guide you.
Enjoy!
May profits be upon you.
Leave any questions or comments in the comment section.
I appreciate any feedback from my viewers!
Like and/or subscribe if you want more accurate analysis.
Thank you so much!
Disclaimer:
I do not provide personal investment advice and I am not a qualified licensed investment advisor.
All information found here, including any ideas, opinions, views, predictions, forecasts, commentaries, suggestions, expressed or implied herein, are for informational, entertainment or educational purposes only and should not be construed as personal investment advice. While the information provided is believed to be accurate, it may include errors or inaccuracies.
I will not and cannot be held liable for any actions you take as a result of anything you read here.
Conduct your own due diligence, or consult a licensed financial advisor or broker before making any and all investment decisions. Any investments, trades, speculations, or decisions made on the basis of any information found on this channel, expressed or implied herein, are committed at your own risk, financial or otherwise.

GU about to have Diarrhea! price has been very bearish on price action. We not have a significant pull back to a area price can possibly react to. if it can maintain below this level we can get a continuation in trend. Trying to get it where I fit in and get some scalps OTW.

Bearish drop?GBP/USD is rising towards the resistance level which is a pullback resistance that lines up with the 23.6% Fibonacci retracement and could drop from this level to our take profit.
Entry: 1.2943
Why we like it:
There is a pullback resistance level that lines up with the 23.6% Fibonacci retracement.
Stop loss: 1.2999
Why we like it:
There is a pullback resistance level that lines up with the 50% Fibonacci retracement.
Take profit: 1.2885
Why we like it:
There is a pullback support level.
Enjoying your TradingView experience? Review us!
Please be advised that the information presented on TradingView is provided to Vantage (‘Vantage Global Limited’, ‘we’) by a third-party provider (‘Everest Fortune Group’). Please be reminded that you are solely responsible for the trading decisions on your account. There is a very high degree of risk involved in trading. Any information and/or content is intended entirely for research, educational and informational purposes only and does not constitute investment or consultation advice or investment strategy. The information is not tailored to the investment needs of any specific person and therefore does not involve a consideration of any of the investment objectives, financial situation or needs of any viewer that may receive it. Kindly also note that past performance is not a reliable indicator of future results. Actual results may differ materially from those anticipated in forward-looking or past performance statements. We assume no liability as to the accuracy or completeness of any of the information and/or content provided herein and the Company cannot be held responsible for any omission, mistake nor for any loss or damage including without limitation to any loss of profit which may arise from reliance on any information supplied by Everest Fortune Group.

Carefull...GU might just FLIP! Monitoring price action and its looking like the Bulls might want to turn this thing around. Sitting on hands for now, waiting for London session to have more data to judge if its worth it to take a position. The dollar is looking like its almost out of energy and needs to take a rest.

GU is bearish for now looks like...Waiting for a sale position to show up. The dollar is showing strength and not slowing up for now. just be patient for the right position.

GBPUSD H8 - Long Signal 1.30 HANDLE GBPUSD H8
We broke slightly south of our 1.30 handle and psychological price late last week, that being said, it was fairly minor, merely just 30 points. We have now adjusted our entry price and SL positioning in the case this setup wants to attempt to break higher. We have an attractive area of support and demand, mixed with the previously mentioned confluences.
Not a great deal of data out today, so maybe it’s worth monitoring these trading zones and prices and waiting until the volume really starts to drive in. DXY approaching that 104.000 number, this is where we would expect rejections and therefore GBPUSD to climb higher, but in the interim, this may lead GPBUSD to trade south of 1.30 again in the short term. Let’s see what unfolds, but this is certainly on the watchlist this week.

GBPUSD Potential DownsidesHey Traders, in today's trading session we are monitoring GBPUSD for a selling opportunity around 1.30650 zone, GBPUSD is trading in a downtrend and currently is in a correction phase in which it is approaching the trend at 1.30650 support and resistance area.
Trade safe, Joe.
