Bearish drop?GBP/USD has reacted off the resistance level which is a pullback resistance and could drop from this level to our take profit.
Entry: 1.3610
Why we like it:
There is a resistance level.
Stop loss: 1.3644
Why we like it:
There is a resistance level at the 161.8% Fibonacci extension.
Take profit: 1.3560
Why we like it:
There is a pullback support level that is slightly below the 61.8% Fibonacci retracement.
Enjoying your TradingView experience? Review us!
Please be advised that the information presented on TradingView is provided to Vantage (‘Vantage Global Limited’, ‘we’) by a third-party provider (‘Everest Fortune Group’). Please be reminded that you are solely responsible for the trading decisions on your account. There is a very high degree of risk involved in trading. Any information and/or content is intended entirely for research, educational and informational purposes only and does not constitute investment or consultation advice or investment strategy. The information is not tailored to the investment needs of any specific person and therefore does not involve a consideration of any of the investment objectives, financial situation or needs of any viewer that may receive it. Kindly also note that past performance is not a reliable indicator of future results. Actual results may differ materially from those anticipated in forward-looking or past performance statements. We assume no liability as to the accuracy or completeness of any of the information and/or content provided herein and the Company cannot be held responsible for any omission, mistake nor for any loss or damage including without limitation to any loss of profit which may arise from reliance on any information supplied by Everest Fortune Group.
Gbp-usd

Bullish bounce for the Cable?The price is falling towards the pivot which is a pullback support and could bounce to the 1st resistance.
Pivot: 1.3409
1st Support: 1.3108
1st Resistance: 1.3768
Risk Warning:
Trading Forex and CFDs carries a high level of risk to your capital and you should only trade with money you can afford to lose. Trading Forex and CFDs may not be suitable for all investors, so please ensure that you fully understand the risks involved and seek independent advice if necessary.
Disclaimer:
The above opinions given constitute general market commentary, and do not constitute the opinion or advice of IC Markets or any form of personal or investment advice.
Any opinions, news, research, analyses, prices, other information, or links to third-party sites contained on this website are provided on an "as-is" basis, are intended only to be informative, is not an advice nor a recommendation, nor research, or a record of our trading prices, or an offer of, or solicitation for a transaction in any financial instrument and thus should not be treated as such. The information provided does not involve any specific investment objectives, financial situation and needs of any specific person who may receive it. Please be aware, that past performance is not a reliable indicator of future performance and/or results. Past Performance or Forward-looking scenarios based upon the reasonable beliefs of the third-party provider are not a guarantee of future performance. Actual results may differ materially from those anticipated in forward-looking or past performance statements. IC Markets makes no representation or warranty and assumes no liability as to the accuracy or completeness of the information provided, nor any loss arising from any investment based on a recommendation, forecast or any information supplied by any third-party.

GBPUSD – Sterling Slips Amid Geopolitical Risk |GBPUSD – Sterling Slips Amid Geopolitical Risk | Will Support Hold for a Bounce?
🌍 Macro & Geopolitical Overview
The British Pound (GBP) is under pressure as risk sentiment deteriorates following a sharp escalation between Israel and Iran.
Israel launched a major military campaign, striking dozens of nuclear and military facilities in northeastern Tehran.
PM Netanyahu announced the start of "Operation Rising Lion", aimed at eliminating the Iranian nuclear threat.
US President Donald Trump voiced support, stating that Iran “must never have a nuclear bomb.”
Investors reacted by fleeing to safe-haven assets, pushing the US Dollar (DXY) from 97.60 to nearly 98.30.
Meanwhile, next week’s Bank of England (BoE) and Federal Reserve meetings are in focus. Both are expected to hold rates steady, but weak UK economic data may pressure the BoE to adopt a more cautious or dovish tone.
📉 Technical Analysis – H1 Chart
🔸 Trend Structure
GBPUSD broke down from its recent high at 1.36288 and is now approaching key support between 1.35350 and 1.34957.
As long as 1.3495 holds, the move appears to be a technical correction, not a reversal.
🔸 Fibonacci & Moving Averages
Current price sits near Fibonacci 0.236 retracement of the recent swing.
Price is trading below the EMA 13 & 34, but EMA 200 near 1.353x still acts as potential support.
🔸 Resistance to Watch
The next upside target sits at 1.3588, followed by the previous high at 1.3628.
🧠 Market Sentiment
Risk aversion is dominating due to geopolitical headlines.
GBP is vulnerable as a risk-sensitive currency.
However, if tensions ease and central bank decisions next week come in line with expectations, GBP could rebound from its currently discounted levels.
🎯 Trade Setup Suggestion
✅ BUY ZONE: 1.35350 – 1.34957
Stop-Loss: 1.3460
Take-Profit Targets: 1.3588 → 1.3628
Enter only on bullish price action confirmation around the support zone.
✅ Conclusion
GBPUSD is trading under geopolitical stress, but the technical setup around 1.3495 – 1.3535 offers a potential bounce zone. A short-term recovery could unfold if sentiment stabilizes and central banks maintain the expected policy stance.

Potential bullish rise?The Cable (GBP/ISD) has bounced off the pivot and could rise to the 1st resistance.
Pivot: 1.3580
1st Support: 1.3540
1st Resistance: 1.3662
Risk Warning:
Trading Forex and CFDs carries a high level of risk to your capital and you should only trade with money you can afford to lose. Trading Forex and CFDs may not be suitable for all investors, so please ensure that you fully understand the risks involved and seek independent advice if necessary.
Disclaimer:
The above opinions given constitute general market commentary, and do not constitute the opinion or advice of IC Markets or any form of personal or investment advice.
Any opinions, news, research, analyses, prices, other information, or links to third-party sites contained on this website are provided on an "as-is" basis, are intended only to be informative, is not an advice nor a recommendation, nor research, or a record of our trading prices, or an offer of, or solicitation for a transaction in any financial instrument and thus should not be treated as such. The information provided does not involve any specific investment objectives, financial situation and needs of any specific person who may receive it. Please be aware, that past performance is not a reliable indicator of future performance and/or results. Past Performance or Forward-looking scenarios based upon the reasonable beliefs of the third-party provider are not a guarantee of future performance. Actual results may differ materially from those anticipated in forward-looking or past performance statements. IC Markets makes no representation or warranty and assumes no liability as to the accuracy or completeness of the information provided, nor any loss arising from any investment based on a recommendation, forecast or any information supplied by any third-party.

Bullish bounce off overlap support?GBP/USD is falling towards the support level which is an overlap support that aligns with the 38.2% Fibonacci retracement and could bounce from this level to our take profit.
Entry: 1.3543
Why we like it:
There is an overlap support level that aligns with the 38.2% Fibonacci re4tracement.
Stop loss: 1.3493
Why we like it:
There is a pullback support level that is slightly below the 61.8% Fibonacci retracement.
Take profit: 1.3601
Why we like it:
There is a pullback resistance level.
Enjoying your TradingView experience? Review us!
Please be advised that the information presented on TradingView is provided to Vantage (‘Vantage Global Limited’, ‘we’) by a third-party provider (‘Everest Fortune Group’). Please be reminded that you are solely responsible for the trading decisions on your account. There is a very high degree of risk involved in trading. Any information and/or content is intended entirely for research, educational and informational purposes only and does not constitute investment or consultation advice or investment strategy. The information is not tailored to the investment needs of any specific person and therefore does not involve a consideration of any of the investment objectives, financial situation or needs of any viewer that may receive it. Kindly also note that past performance is not a reliable indicator of future results. Actual results may differ materially from those anticipated in forward-looking or past performance statements. We assume no liability as to the accuracy or completeness of any of the information and/or content provided herein and the Company cannot be held responsible for any omission, mistake nor for any loss or damage including without limitation to any loss of profit which may arise from reliance on any information supplied by Everest Fortune Group.

Bearish drop off major resistance?Cable (GBP/USD) has reacted off the pivot which acts as an overlap resistance and could drop to the 1st support which is a pullback support.
Pivot: 1.3506
1st Support: 1.3423
1st Resistance: 1.3586
Risk Warning:
Trading Forex and CFDs carries a high level of risk to your capital and you should only trade with money you can afford to lose. Trading Forex and CFDs may not be suitable for all investors, so please ensure that you fully understand the risks involved and seek independent advice if necessary.
Disclaimer:
The above opinions given constitute general market commentary, and do not constitute the opinion or advice of IC Markets or any form of personal or investment advice.
Any opinions, news, research, analyses, prices, other information, or links to third-party sites contained on this website are provided on an "as-is" basis, are intended only to be informative, is not an advice nor a recommendation, nor research, or a record of our trading prices, or an offer of, or solicitation for a transaction in any financial instrument and thus should not be treated as such. The information provided does not involve any specific investment objectives, financial situation and needs of any specific person who may receive it. Please be aware, that past performance is not a reliable indicator of future performance and/or results. Past Performance or Forward-looking scenarios based upon the reasonable beliefs of the third-party provider are not a guarantee of future performance. Actual results may differ materially from those anticipated in forward-looking or past performance statements. IC Markets makes no representation or warranty and assumes no liability as to the accuracy or completeness of the information provided, nor any loss arising from any investment based on a recommendation, forecast or any information supplied by any third-party.

Potential bearish breakout?GBP/USD is reacting off the support level which is an overlap support that aligns with the 38.2% Fibonacci retracement and could drop from this level to our take profit.
Entry: 1.3501
Why we like it:
There is an overlap support level that lines up with the 38.2% Fibonacci retracement.
Stop loss: 1.3535
Why we like it:
There is an overlap resistance level that lines up with the 61.8% Fibonacci retracement.
Take profit: 1.3450
Why we like it:
There is a pullback support level.
Enjoying your TradingView experience? Review us!
Please be advised that the information presented on TradingView is provided to Vantage (‘Vantage Global Limited’, ‘we’) by a third-party provider (‘Everest Fortune Group’). Please be reminded that you are solely responsible for the trading decisions on your account. There is a very high degree of risk involved in trading. Any information and/or content is intended entirely for research, educational and informational purposes only and does not constitute investment or consultation advice or investment strategy. The information is not tailored to the investment needs of any specific person and therefore does not involve a consideration of any of the investment objectives, financial situation or needs of any viewer that may receive it. Kindly also note that past performance is not a reliable indicator of future results. Actual results may differ materially from those anticipated in forward-looking or past performance statements. We assume no liability as to the accuracy or completeness of any of the information and/or content provided herein and the Company cannot be held responsible for any omission, mistake nor for any loss or damage including without limitation to any loss of profit which may arise from reliance on any information supplied by Everest Fortune Group.

Bearish breakout?The Cable (GBP/USD) is falling towards the pivot, which is an overlap support, and could bounce to the 1st resistance which is a pullback resistance.
Pivot: 1.3505
1st Support: 1.3415
1st Resistance: 1.3581
Risk Warning:
Trading Forex and CFDs carries a high level of risk to your capital and you should only trade with money you can afford to lose. Trading Forex and CFDs may not be suitable for all investors, so please ensure that you fully understand the risks involved and seek independent advice if necessary.
Disclaimer:
The above opinions given constitute general market commentary, and do not constitute the opinion or advice of IC Markets or any form of personal or investment advice.
Any opinions, news, research, analyses, prices, other information, or links to third-party sites contained on this website are provided on an "as-is" basis, are intended only to be informative, is not an advice nor a recommendation, nor research, or a record of our trading prices, or an offer of, or solicitation for a transaction in any financial instrument and thus should not be treated as such. The information provided does not involve any specific investment objectives, financial situation and needs of any specific person who may receive it. Please be aware, that past performance is not a reliable indicator of future performance and/or results. Past Performance or Forward-looking scenarios based upon the reasonable beliefs of the third-party provider are not a guarantee of future performance. Actual results may differ materially from those anticipated in forward-looking or past performance statements. IC Markets makes no representation or warranty and assumes no liability as to the accuracy or completeness of the information provided, nor any loss arising from any investment based on a recommendation, forecast or any information supplied by any third-party.

09/06/2025: WILL WE SEE A BREAKOUT ABOVE 1.3550?GBP/USD PLAN – 09/06/2025: WILL WE SEE A BREAKOUT ABOVE 1.3550?
🌍 Macroeconomic & Fundamental Context:
UK Economic Outlook (BoE): The Bank of England (BoE) is under pressure due to inflation and has to make decisions regarding interest rate policy. Diverging opinions on whether to raise or lower rates are creating uncertainty in the market.
US Economic Outlook (Fed): The Federal Reserve's monetary policy continues to be a major influence on the USD, especially as the Fed maintains its rate hikes to control inflation.
US-UK Trade Relations: Trade negotiations between the US and the UK will remain an important factor this week, and any new developments could impact GBP/USD.
📉 Technical Analysis – GBP/USD:
On the H4 and H1 timeframes, GBP/USD is consolidating within a corrective structure, and price has broken several key Fibonacci levels. The EMA indicators (13, 34, 89) are showing strong momentum.
Key Resistance Levels:
1.3550 – This is a major resistance level. If broken, GBP/USD could continue its rally towards 1.3612.
Key Support Levels:
1.3520 – A short-term support level. If this breaks, price may retrace back to 1.3470.
🎯 Trading Scenarios for Today:
🟢 BUY ZONE:
Buy Zone: 1.3520 – 1.3500
SL: 1.3480
TP: 1.3550 → 1.3570 → 1.3600 → 1.3620 → 1.3650
If price retraces to 1.3520 – 1.3500, this would be an ideal buying opportunity with a target at 1.3550. Look for confirmation from technical indicators and the current trend.
🔴 SELL ZONE:
Sell Zone: 1.3550 – 1.3570
SL: 1.3590
TP: 1.3520 → 1.3500 → 1.3470 → 1.3450 → 1.3420
If price reaches the resistance zone of 1.3550 – 1.3570, consider selling with targets at the support levels below.
🟡 Scalping:
Buy Scalping: 1.3520 → 1.3500
Sell Scalping: 1.3570 → 1.3600
Look for short-term opportunities when price moves within the range.
⚠️ Important Notes:
Pay close attention to short-term fluctuations and any major economic data releases from the BoE and Fed.
Risk management is key during volatile periods.
📌 Conclusion:
GBP/USD is in a short-term corrective phase, but a breakout above 1.3550 could trigger a strong rally. Traders should monitor support and resistance levels carefully and ensure risk management is in place.

Bullish bounce off pullback support?The Cable (GBP/USD) is falling towards the pivot which is a pullback support and could bounce to the 1st resistance.
Pivot: 1.3411
1st Support: 1.3100
1st Resistance: 1.3714
Risk Warning:
Trading Forex and CFDs carries a high level of risk to your capital and you should only trade with money you can afford to lose. Trading Forex and CFDs may not be suitable for all investors, so please ensure that you fully understand the risks involved and seek independent advice if necessary.
Disclaimer:
The above opinions given constitute general market commentary, and do not constitute the opinion or advice of IC Markets or any form of personal or investment advice.
Any opinions, news, research, analyses, prices, other information, or links to third-party sites contained on this website are provided on an "as-is" basis, are intended only to be informative, is not an advice nor a recommendation, nor research, or a record of our trading prices, or an offer of, or solicitation for a transaction in any financial instrument and thus should not be treated as such. The information provided does not involve any specific investment objectives, financial situation and needs of any specific person who may receive it. Please be aware, that past performance is not a reliable indicator of future performance and/or results. Past Performance or Forward-looking scenarios based upon the reasonable beliefs of the third-party provider are not a guarantee of future performance. Actual results may differ materially from those anticipated in forward-looking or past performance statements. IC Markets makes no representation or warranty and assumes no liability as to the accuracy or completeness of the information provided, nor any loss arising from any investment based on a recommendation, forecast or any information supplied by any third-party.

GBPUSD: Weekly Overview 9th of June 2025GDP m/m is in this week! Take this under consideration. Any significant bearish surprise for this announcement means a possible break of the bullish channel.
******************************************
The indicated levels are determined based on the most reaction points and the assumption of approximately equal distance between the zones.
Some of these points can also be confirmed by the mathematical intervals of Murray.
You can enter with/without confirmation. IF you want to take confirmation you can use LTF analysis, Spike move confirmation, Trend Strength confirmation and ETC.
SL could be placed below the zone or regarding the LTF swings.
TP is the next zone or the nearest moving S&R, which are median and borders of the drawn channels.
*******************************************************************
Role of different zones:
GREEN: Just long trades allowed on them.
RED: Just Short trades allowed on them.
BLUE: both long and short trades allowed on them.
WHITE: No trades allowed on them! just use them as TP points

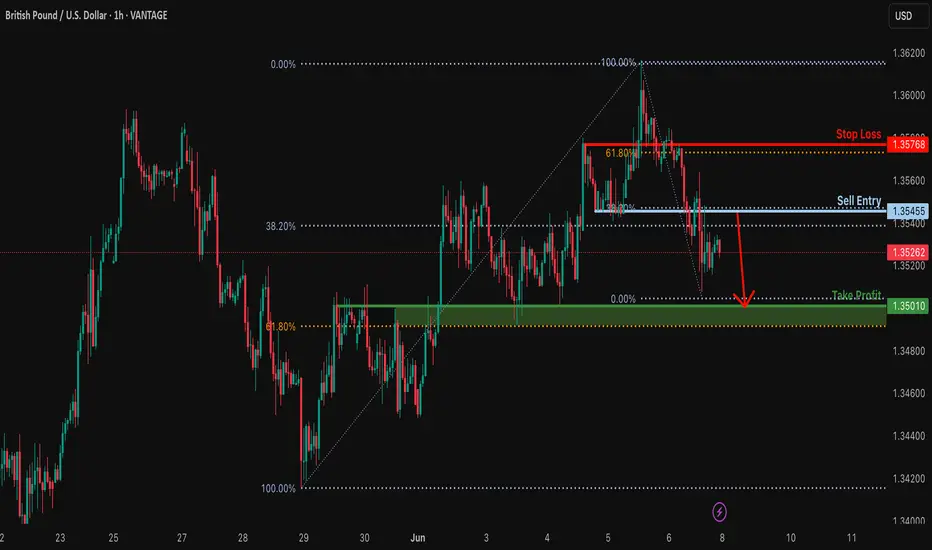
Potential bearish drop?GBP/USD is rising towards the resistance level which is an overlap resistance that lines up with the 38.2% Fibonacci retracement and could drop from this level to our take profit.
Entry: 1.3545
Why we like it:
There is an overlap resistance that aligns with the 48.2% Fibonacci retracement.
Stop loss: 1.3576
Why we like it:
There is a pullback resistance level that lines up with the 61.8% Fibonacci retracement.
Take profit: 1.3501
Why we like it:
There is an overlap support level that is slightly above the 61.8% Fibonacci retracement.
Enjoying your TradingView experience? Review us!
Please be advised that the information presented on TradingView is provided to Vantage (‘Vantage Global Limited’, ‘we’) by a third-party provider (‘Everest Fortune Group’). Please be reminded that you are solely responsible for the trading decisions on your account. There is a very high degree of risk involved in trading. Any information and/or content is intended entirely for research, educational and informational purposes only and does not constitute investment or consultation advice or investment strategy. The information is not tailored to the investment needs of any specific person and therefore does not involve a consideration of any of the investment objectives, financial situation or needs of any viewer that may receive it. Kindly also note that past performance is not a reliable indicator of future results. Actual results may differ materially from those anticipated in forward-looking or past performance statements. We assume no liability as to the accuracy or completeness of any of the information and/or content provided herein and the Company cannot be held responsible for any omission, mistake nor for any loss or damage including without limitation to any loss of profit which may arise from reliance on any information supplied by Everest Fortune Group.
Bullish continuation?The Cable (GBP/USD) is falling towards the pivot, which is an overlap support and could rise to the 1st resistance.
Pivot: 1.3507
1st Support: 1.3420
1st Resistance: 1.3644
Risk Warning:
Trading Forex and CFDs carries a high level of risk to your capital and you should only trade with money you can afford to lose. Trading Forex and CFDs may not be suitable for all investors, so please ensure that you fully understand the risks involved and seek independent advice if necessary.
Disclaimer:
The above opinions given constitute general market commentary, and do not constitute the opinion or advice of IC Markets or any form of personal or investment advice.
Any opinions, news, research, analyses, prices, other information, or links to third-party sites contained on this website are provided on an "as-is" basis, are intended only to be informative, is not an advice nor a recommendation, nor research, or a record of our trading prices, or an offer of, or solicitation for a transaction in any financial instrument and thus should not be treated as such. The information provided does not involve any specific investment objectives, financial situation and needs of any specific person who may receive it. Please be aware, that past performance is not a reliable indicator of future performance and/or results. Past Performance or Forward-looking scenarios based upon the reasonable beliefs of the third-party provider are not a guarantee of future performance. Actual results may differ materially from those anticipated in forward-looking or past performance statements. IC Markets makes no representation or warranty and assumes no liability as to the accuracy or completeness of the information provided, nor any loss arising from any investment based on a recommendation, forecast or any information supplied by any third-party.

GBPUSD Potential UpsidesHey Traders, in today's trading session we are monitoring GBPUSD for a buying opportunity around 1.35400 zone, GBPUSD is trading in an uptrend and currently is in a correction phase in which it is approaching the trend at 1.35400 support and resistance area.
Trade safe, Joe.

Bearish drop off pullback resistance?GBP/USD is reacting off the resistance level which is a pullback resistance that aligns with the 138.2% Fibonacci extension and could drop from this level to our take profit.
Entry: 1.3590
Why we like it:
There is a pullback resistance that aligns with the 138.2% Fibonacci extension.
Stop loss: 1.3629
Why we like it:
There is a resistance level at the 100% Fibonacci projection.
Take profit: 1.3535
Why we like it:
There is an overlap support level that aligns with the 61.8% Fibonacci retracement.
Enjoying your TradingView experience? Review us!
Please be advised that the information presented on TradingView is provided to Vantage (‘Vantage Global Limited’, ‘we’) by a third-party provider (‘Everest Fortune Group’). Please be reminded that you are solely responsible for the trading decisions on your account. There is a very high degree of risk involved in trading. Any information and/or content is intended entirely for research, educational and informational purposes only and does not constitute investment or consultation advice or investment strategy. The information is not tailored to the investment needs of any specific person and therefore does not involve a consideration of any of the investment objectives, financial situation or needs of any viewer that may receive it. Kindly also note that past performance is not a reliable indicator of future results. Actual results may differ materially from those anticipated in forward-looking or past performance statements. We assume no liability as to the accuracy or completeness of any of the information and/or content provided herein and the Company cannot be held responsible for any omission, mistake nor for any loss or damage including without limitation to any loss of profit which may arise from reliance on any information supplied by Everest Fortune Group.

GBPUSD 4H MAJOR REVERSAL SETUP – WATCH FOR THE BREAK!Hey There;
The Head & Shoulders (H&S) pattern in GBPUSD is becoming more defined, approaching a critical neckline level. If a breakout occurs, it could trigger a strong downward move, pushing the price toward new support levels.
Right now, sellers are gaining strength while buyers attempt to defend key support zones. A confirmed close below the neckline could accelerate the sell-off.
📌 If the breakout happens, I’ll share target levels with you—stay tuned for updates
I meticulously prepare these analyses for you, and I sincerely appreciate your support through likes. Every like from you is my biggest motivation to continue sharing my analyses.
I’m truly grateful for each of you—love to all my followers💙💙💙

Bullish bounce off 50% Fibonacci support?GBP/USD is falling towards the support level which is a pullback support that aligns with the 50% Fibonacci retracement and could bounce from this level to our take profit.
Entry: 1.3536
Why we like it:
There is a pullback support level that lines up with the 50% Fibonacci retracement.
Stop loss: 1.3510
Why we like it:
There is a pullback support level that is slightly below the 78.6% Fibonacci retracement.
Take profit: 1.3590
Why we like it:
There is a pullback resistance level that aligns with the 138.2% Fibonacci extension.
Enjoying your TradingView experience? Review us!
Please be advised that the information presented on TradingView is provided to Vantage (‘Vantage Global Limited’, ‘we’) by a third-party provider (‘Everest Fortune Group’). Please be reminded that you are solely responsible for the trading decisions on your account. There is a very high degree of risk involved in trading. Any information and/or content is intended entirely for research, educational and informational purposes only and does not constitute investment or consultation advice or investment strategy. The information is not tailored to the investment needs of any specific person and therefore does not involve a consideration of any of the investment objectives, financial situation or needs of any viewer that may receive it. Kindly also note that past performance is not a reliable indicator of future results. Actual results may differ materially from those anticipated in forward-looking or past performance statements. We assume no liability as to the accuracy or completeness of any of the information and/or content provided herein and the Company cannot be held responsible for any omission, mistake nor for any loss or damage including without limitation to any loss of profit which may arise from reliance on any information supplied by Everest Fortune Group.

GBPUSD – Is the Recovery Losing Steam? GBPUSD – Is the Recovery Losing Steam? Watch for Technical Pullback Ahead of NFP
The GBPUSD pair has recently rebounded impressively from the 1.3427 key support zone, reflecting short-term USD weakness and growing speculation of rate cuts by the Fed. However, after the strong bullish move, the market is now showing signs of exhaustion and potential profit-taking—especially with high-impact US employment data just around the corner.
🔍 Macro & Fundamental Overview:
United States: All eyes are on this week’s JOLTS and Non-Farm Payrolls (NFP) reports. Weak jobs data could strengthen the case for rate cuts by the Fed in Q3, weighing on the US Dollar. On the flip side, a solid print would revive “higher for longer” rate expectations and likely support USD strength.
United Kingdom: Although inflation remains above the Bank of England’s 2% target, political uncertainty ahead of July’s general election may keep GBP on the defensive, especially if BoE signals a dovish turn.
Bond Yield Spread (UK vs US): A widening spread in favor of the USD is exerting downward pressure on GBPUSD in the medium term.
📈 Technical Outlook (H1 Chart):
Structure: Price has formed a double-top pattern at 1.35598 and 1.35322, with multiple rejections—signaling a weakening bullish momentum after a sustained rally.
EMA 13 – 34 – 89 – 200 Setup: Price is currently testing the EMA89 zone (~1.34854). A clean break below this moving average could accelerate the downside correction.
FVG Zone (Liquidity Pool): The 1.3427 – 1.3457 area offers a potential liquidity sweep and may serve as a springboard for the next bullish leg.
📊 Trade Scenarios:
🔻 Short-Term SELL SCALP:
Entry: 1.3532 – 1.3545
Stop Loss: 1.3565
Take Profit: 1.3485 → 1.3457 → 1.3427
→ Ideal if price fails to hold above recent highs and forms bearish rejection candles.
🔵 BUY ZONE Setup:
Entry: 1.3427 – 1.3440
Stop Loss: 1.3400
Take Profit: 1.3475 → 1.3505 → 1.3535 → 1.3555
→ High-probability entry if price reacts positively to the FVG zone and maintains bullish structure.
📌 Final Thoughts:
GBPUSD is currently in a delicate zone where both technical and macro forces are converging. While the broader trend remains bullish, momentum is slowing. With critical US jobs data due, traders should stay cautious and rely on clear confirmations around key price levels. Maintain strict risk management and look for liquidity-driven moves around FVG zones.

Potential bearish drop?GBP/USD has rejected off the reistance level which is a pullback resistance and could drop from this level to our take profit.
Entry: 1.3551
Why we like it:
There is a pullback resistance level.
Stop loss: 1.3590
Why we like it:
There is a pullback resistance level.
Take profit: 1.3446
Why we like it:
There is an overlap support level.
Enjoying your TradingView experience? Review us!
Please be advised that the information presented on TradingView is provided to Vantage (‘Vantage Global Limited’, ‘we’) by a third-party provider (‘Everest Fortune Group’). Please be reminded that you are solely responsible for the trading decisions on your account. There is a very high degree of risk involved in trading. Any information and/or content is intended entirely for research, educational and informational purposes only and does not constitute investment or consultation advice or investment strategy. The information is not tailored to the investment needs of any specific person and therefore does not involve a consideration of any of the investment objectives, financial situation or needs of any viewer that may receive it. Kindly also note that past performance is not a reliable indicator of future results. Actual results may differ materially from those anticipated in forward-looking or past performance statements. We assume no liability as to the accuracy or completeness of any of the information and/or content provided herein and the Company cannot be held responsible for any omission, mistake nor for any loss or damage including without limitation to any loss of profit which may arise from reliance on any information supplied by Everest Fortune Group.

Potential bearish drop?GBP/USD has reacted off the resistance level which is a pullback resistance that lines up with the 50% Fibonacci retracement and could drop from this level to our take profit.
Entry: 1.3346
Why we like it:
There is a pullback resistance level that aligns with the 50% Fibonacci retracement.
Stop loss: 1.3591
Why we like it:
There is a pullback resistance level.
Take profit: 1.3346
Why we like it:
There is a pullback support level that lines up with the 50% Fibonacci retracement.
Enjoying your TradingView experience? Review us!
Please be advised that the information presented on TradingView is provided to Vantage (‘Vantage Global Limited’, ‘we’) by a third-party provider (‘Everest Fortune Group’). Please be reminded that you are solely responsible for the trading decisions on your account. There is a very high degree of risk involved in trading. Any information and/or content is intended entirely for research, educational and informational purposes only and does not constitute investment or consultation advice or investment strategy. The information is not tailored to the investment needs of any specific person and therefore does not involve a consideration of any of the investment objectives, financial situation or needs of any viewer that may receive it. Kindly also note that past performance is not a reliable indicator of future results. Actual results may differ materially from those anticipated in forward-looking or past performance statements. We assume no liability as to the accuracy or completeness of any of the information and/or content provided herein and the Company cannot be held responsible for any omission, mistake nor for any loss or damage including without limitation to any loss of profit which may arise from reliance on any information supplied by Everest Fortune Group.

Falling towards 61.8% Fibonacci support?The Cable (GBP/USD) is falling towards the pivot and could bounce to the 1st resistance, which is a pullback resistance.
Pivot: 1.3314
1st Support: 1.3159
1st Resistance: 1.3566
Risk Warning:
Trading Forex and CFDs carries a high level of risk to your capital and you should only trade with money you can afford to lose. Trading Forex and CFDs may not be suitable for all investors, so please ensure that you fully understand the risks involved and seek independent advice if necessary.
Disclaimer:
The above opinions given constitute general market commentary, and do not constitute the opinion or advice of IC Markets or any form of personal or investment advice.
Any opinions, news, research, analyses, prices, other information, or links to third-party sites contained on this website are provided on an "as-is" basis, are intended only to be informative, is not an advice nor a recommendation, nor research, or a record of our trading prices, or an offer of, or solicitation for a transaction in any financial instrument and thus should not be treated as such. The information provided does not involve any specific investment objectives, financial situation and needs of any specific person who may receive it. Please be aware, that past performance is not a reliable indicator of future performance and/or results. Past Performance or Forward-looking scenarios based upon the reasonable beliefs of the third-party provider are not a guarantee of future performance. Actual results may differ materially from those anticipated in forward-looking or past performance statements. IC Markets makes no representation or warranty and assumes no liability as to the accuracy or completeness of the information provided, nor any loss arising from any investment based on a recommendation, forecast or any information supplied by any third-party.

GBPUSD Weekly overview Jun 1, 2025 – Jun 7, 2025We are approaching a strong HTF reversal level from lower prices. It means we might have some unexpectable strong bearish players in the market. I'll take a little less than normal for the bullish trades.
While the mid-term overview indicates us a bullish trend some bearish move won't surprise me.
*******************************************************
The indicated levels are determined based on the most reaction points and the assumption of approximately equal distance between the zones.
Some of these points can also be confirmed by the mathematical intervals of Murray.
You can enter with/without confirmation. IF you want to take confirmation you can use LTF analysis, Spike move confirmation, Trend Strength confirmation and ETC.
SL could be placed below the zone or regarding the LTF swings.
TP is the next zone or the nearest moving S&R, which are median and borders of the drawn channels.
*******************************************************************
Role of different zones:
GREEN: Just long trades allowed on them.
RED: Just Short trades allowed on them.
BLUE: both long and short trades allowed on them.
WHITE: No trades allowed on them! just use them as TP points

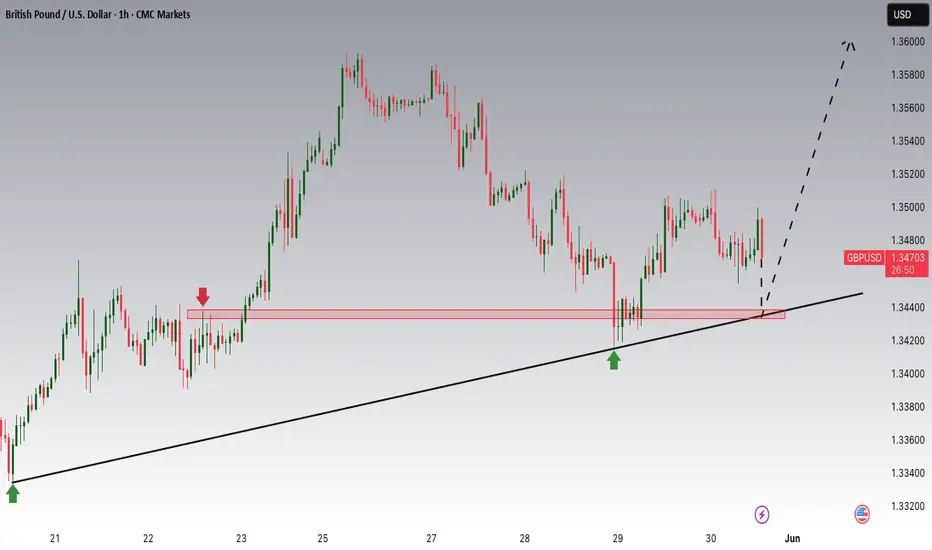
GBPUSD is Nearing an Important Support!!Hey Traders, in today's trading session we are monitoring GBPUSD for a buying opportunity around 1.34400 zone, GBPUSD is trading in an uptrend and currently is in a correction phase in which it is approaching the trend at 1.34400 support and resistance area.
Trade safe, Joe.