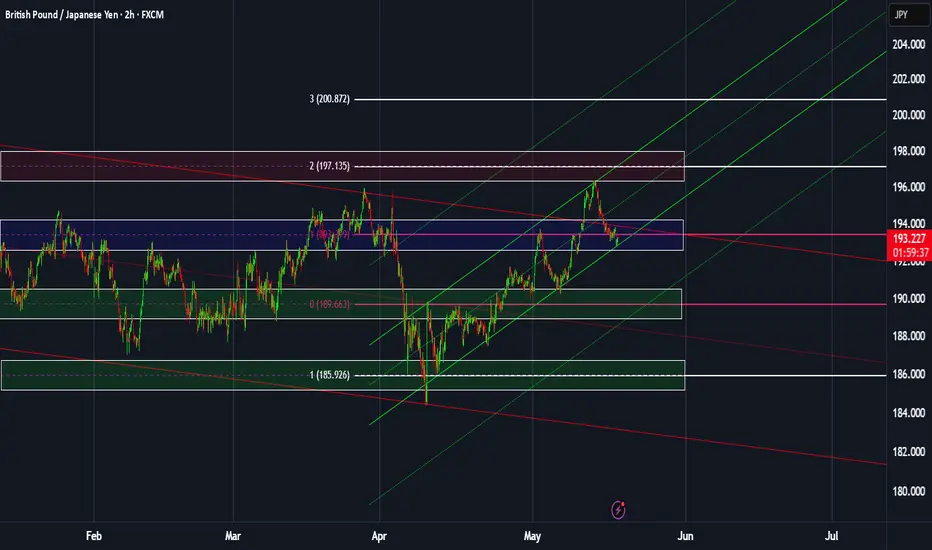
GBPJPY: Weekly overview + Significant zonesHello dear traders,
The indicated levels are determined based on the most reaction points and the assumption of approximately equal distance between the zones.
These points can also be confirmed by the mathematical intervals of Murray.
After reacting to the following zones, you can enter the trade. Place the stop loss slightly above/below the zone to which the reaction was shown. The profit point is the next zone.
The drawn channels and their medians can also be considered as moving support and resistance. I usually use them as target points. I've doubled the short-term channel because it was so thin ;-).
* I don't use 189.663 zone to take short! There are too many moving S&R around it.
This analysis is valid until the end of the week.
**************************************
Important news that could change the direction of the trade:
Wed: Great Britain CPI of April.
GBP
GBPUSD: Weekly overviewThe indicated levels are determined based on the most reaction points and the assumption of approximately equal distance between the zones.
These points can also be confirmed by the mathematical intervals of Murray.
After reacting to the following zones, you can enter the trade. Place the stop loss slightly above/below the zone to which the reaction was shown. The profit point is the next zone.
The drawn channels and their medians can also be considered as moving support and resistance. I usually use them as target points.
* I don't trade the white zone (1.32190), the channel borders and median are so close to it and any breaks below it does not necessarily mean a potential continue in the break direction.
My most important zone is the blue one (1.34291). I'm more ready to take short from it. however, the long option is possible if confirmed.
This analysis is valid until the end of the week.
**************************************
Important news that could change the direction of the trade:
Wednesday: Britain CPI

GBPJPY Channel Down making a Lower High rejectionThe GBPJPY pair rose aggressively since the last time we gave our buy signal (April 11, see chart below), quickly hitting our conservative 109.250 Target:
The price has since made a Lower High rejection at the top of the Channel Down but remains supported by the 1D MA50 (blue trend-line). Once broken and it closes a 1D candle below it, we will have bearish break-out signal. Our Targe will be 185.250, which will be the standard -5.85% decline that all 3 previous Bearish Legs had within the Channel Down.
-------------------------------------------------------------------------------
** Please LIKE 👍, FOLLOW ✅, SHARE 🙌 and COMMENT ✍ if you enjoy this idea! Also share your ideas and charts in the comments section below! This is best way to keep it relevant, support us, keep the content here free and allow the idea to reach as many people as possible. **
-------------------------------------------------------------------------------
💸💸💸💸💸💸
👇 👇 👇 👇 👇 👇

IS THE BULLISH CHANNEL NEARING EXHAUSTION OR JUST GEARING UP?GBPUSD OUTLOOK – IS THE BULLISH CHANNEL NEARING EXHAUSTION OR JUST GEARING UP?
📊 Macro Overview:
The USD continues to soften slightly as markets begin pricing in a potential rate cut by the Fed later in Q3. Meanwhile, the British Pound (GBP) is holding firm, supported by stronger-than-expected UK macroeconomic data—particularly retail sales and inflation figures.
However, UK fiscal concerns remain a headwind, and GBPUSD is highly sensitive to upcoming U.S. data—especially Core PCE and employment figures this week.
📉 Technical Analysis:
On the 1H chart, GBPUSD is moving within a broad ascending channel and is now approaching the upper resistance trendline at 1.3555 – a key zone that could trigger short-term profit-taking.
EMAs 13 and 34 are still in bullish alignment, supporting ongoing momentum.
Despite the bullish setup, current candle structure suggests a potential pullback to the 1.3448 support zone before a continuation higher—if buyers regain control.
🔑 Key Price Levels:
Resistance Zones:
🔸 1.3555 – Channel top resistance
🔸 1.3586 – Extended resistance zone
Support Zones:
🔹 1.3448 – Technical and Fibo confluence
🔹 1.3398 – Major structure support in case of breakdown
🛠️ Trade Scenarios:
✅ Scenario 1: BUY on retracement
Entry: 1.3448 (watch for bullish confirmation on H1)
Stop Loss: 1.3394
Take Profit: 1.3500 → 1.3555 → 1.3585
✅ Scenario 2: SELL scalp from resistance
Entry: 1.3555
Stop Loss: 1.3588
Take Profit: 1.3500 → 1.3460
🧠 Final Thoughts:
GBPUSD remains bullish in structure but is testing key resistance levels. A clean pullback to the 1.3448 region may provide a strong buying opportunity if confirmed by price action. If this level breaks, bearish divergence could kick in and push the pair back to deeper support zones. Stay alert for high-impact economic releases and trade with solid risk management!

GBP/USD - Triangle Breakout (23.05.2025)The GBP/USD pair on the M30 timeframe presents a Potential Buying Opportunity due to a recent Formation of a Triangle Pattern. This suggests a shift in momentum towards the upside and a higher likelihood of further advances in the coming hours.
Possible Long Trade:
Entry: Consider Entering A Long Position around Trendline Of The Pattern.
Target Levels:
1st Resistance – 1.3502
2nd Resistance – 1.3534
🎁 Please hit the like button and
🎁 Leave a comment to support for My Post !
Your likes and comments are incredibly motivating and will encourage me to share more analysis with you.
Best Regards, KABHI_TA_TRADING
Thank you.
Disclosure: I am part of Trade Nation's Influencer program and receive a monthly fee for using their TradingView charts in my analysis.

Bearish drop off pullback resistance?GBP/JPY is rising towards the pivot and could drop to the 1st support, which is a pullback support.
Pivot: 193.76
1st Support: 191.56
1st Resistance: 194.80
Risk Warning:
Trading Forex and CFDs carries a high level of risk to your capital and you should only trade with money you can afford to lose. Trading Forex and CFDs may not be suitable for all investors, so please ensure that you fully understand the risks involved and seek independent advice if necessary.
Disclaimer:
The above opinions given constitute general market commentary, and do not constitute the opinion or advice of IC Markets or any form of personal or investment advice.
Any opinions, news, research, analyses, prices, other information, or links to third-party sites contained on this website are provided on an "as-is" basis, are intended only to be informative, is not an advice nor a recommendation, nor research, or a record of our trading prices, or an offer of, or solicitation for a transaction in any financial instrument and thus should not be treated as such. The information provided does not involve any specific investment objectives, financial situation and needs of any specific person who may receive it. Please be aware, that past performance is not a reliable indicator of future performance and/or results. Past Performance or Forward-looking scenarios based upon the reasonable beliefs of the third-party provider are not a guarantee of future performance. Actual results may differ materially from those anticipated in forward-looking or past performance statements. IC Markets makes no representation or warranty and assumes no liability as to the accuracy or completeness of the information provided, nor any loss arising from any investment based on a recommendation, forecast or any information supplied by any third-party.

GBP/JPY Holds Key Support as Bullish Momentum BuildsA bullish setup has emerged on GBP/JPY, with recent price action suggesting bullish momentum is building. With GBP strengthening against USD, GBP/JPY may present a higher-probability bullish scenario compared to USD/JPY in the near term (though this also looks bullish to my eyes over the near term).
GBP/JPY held above key moving averages midweek. GBP/JPY failed to close below its 200-day SMA on both Wednesday and Thursday, while yesterday’s session also respected support at the 50-day EMA and the 192.00 handle.
Momentum indicators support the bullish case, with the daily RSI trading above 50 after rebounding from its most oversold level in six weeks.
As long as prices hold above Thursday’s low, bulls may look for a retest of the cycle highs near 196.00.
** Please note that Japan's CPI data drops in >30 minutes **
Matt Simpson, Market Analyst at City Index and Forex.com

Bearish drop?GBP/USD has rejected off the resistance level which is a pullback resistance and could drop from this level to our take profit.
Entry: 1.3442
Why we like it:
There is a pullback resistance level.
Stop loss: 1.3505
Why we like it:
There is a resistance level at the 138.2% Fibonacci extension.
Take profit: 1.3318
Why we like it:
There is a support level that lines up with the 50% Fibonacci retracement.
Enjoying your TradingView experience? Review us!
Please be advised that the information presented on TradingView is provided to Vantage (‘Vantage Global Limited’, ‘we’) by a third-party provider (‘Everest Fortune Group’). Please be reminded that you are solely responsible for the trading decisions on your account. There is a very high degree of risk involved in trading. Any information and/or content is intended entirely for research, educational and informational purposes only and does not constitute investment or consultation advice or investment strategy. The information is not tailored to the investment needs of any specific person and therefore does not involve a consideration of any of the investment objectives, financial situation or needs of any viewer that may receive it. Kindly also note that past performance is not a reliable indicator of future results. Actual results may differ materially from those anticipated in forward-looking or past performance statements. We assume no liability as to the accuracy or completeness of any of the information and/or content provided herein and the Company cannot be held responsible for any omission, mistake nor for any loss or damage including without limitation to any loss of profit which may arise from reliance on any information supplied by Everest Fortune Group.

GBPUSD: MACD Cross confirms more upsideGBPUSD is bullish on its 1D technical outlook (RSI = 59.696, MACD = 0.006, ADX = 36.278) as it's been inside a Channel Up since the start of the year (January 13th 2025 low). At the moment the 1D MA50 is holding and provides the short term support. The 1D MACD just formed a Bullish Cross, validating the new bullish wave. We are bullish, aiming for another +3.63% HH rise (TP = 1.3600).
See how our prior idea has worked out:
## If you like our free content follow our profile to get more daily ideas. ##
## Comments and likes are greatly appreciated. ##

Falling towards 38.2% Fibonacci support?GBP/JPY is falling towards the pivot and could bounce to the 1st, pullback resistance.
Pivot: 191.56
1st Support: 190.35
1st Resistance: 193.65
Risk Warning:
Trading Forex and CFDs carries a high level of risk to your capital and you should only trade with money you can afford to lose. Trading Forex and CFDs may not be suitable for all investors, so please ensure that you fully understand the risks involved and seek independent advice if necessary.
Disclaimer:
The above opinions given constitute general market commentary, and do not constitute the opinion or advice of IC Markets or any form of personal or investment advice.
Any opinions, news, research, analyses, prices, other information, or links to third-party sites contained on this website are provided on an "as-is" basis, are intended only to be informative, is not an advice nor a recommendation, nor research, or a record of our trading prices, or an offer of, or solicitation for a transaction in any financial instrument and thus should not be treated as such. The information provided does not involve any specific investment objectives, financial situation and needs of any specific person who may receive it. Please be aware, that past performance is not a reliable indicator of future performance and/or results. Past Performance or Forward-looking scenarios based upon the reasonable beliefs of the third-party provider are not a guarantee of future performance. Actual results may differ materially from those anticipated in forward-looking or past performance statements. IC Markets makes no representation or warranty and assumes no liability as to the accuracy or completeness of the information provided, nor any loss arising from any investment based on a recommendation, forecast or any information supplied by any third-party.

#002 GBP/CHF SHORT Investment Opportunity
👋 Hello, I am Forex Trader Andrea Russo, founder of the SwipeUP Method, a professional analysis approach based on 16 integrated modules that combines artificial intelligence, cyclicality, macro data, technical analysis and institutional positioning.
Today I present a new SHORT investment opportunity on GBP/CHF, analyzed and validated according to my DEFINITIVE PROMPT.
📌 Trade Parameters
Pair: GBP/CHF
Direction: Short
Main Timeframe: 8H
Entry Point: 1.10745 (Red/Purple Box Intersection)
Stop Loss: 1.11515 (End of Red Box)
Take Profit: 1.08335 (End of Purple Box)
Risk: ~77 pips
Target: ~411 pips
Risk/Reward Ratio: ~1:5.33
Expected Return: +3.71%
SwipeUP Model Reliability: 91%
🔍 SwipeUP Method Analysis (16 Modules)
1. Multi-timeframe Technical Analysis
Weekly: Correction after Historical Bearish Impulse.
Daily: Bullish Impulse Exhausted Below Key Resistance.
8H: first bearish breakout on dynamic support, with pullback completed.
✔️ Short trend confirmed on H8 and daily.
2. Technical indicators
WaveTrend: complete bearish crossover in overbought zone.
Stochastic: confirmed cross down.
EMA: breakout below all moving averages.
✔️ Total bearish alignment of indicators.
3. Cyclical and harmonic analysis
Harmonic completed (Bat type) with theoretical target in TP zone.
Weekly cycles show exhaustion of the bullish movement.
✔️ Cyclical and short harmonic validation.
4. Mathematics and statistics
Fibonacci 61.8% retracement completed.
127.2% extension targeted as short target.
✔️ Favorable mathematical patterns.
5. Market Sentiment
72% long retail GBP/CHF (fxssi.com).
Favorable misalignment for short.
✔️ Valid contrarian strategy.
6. Institutional positioning
COT: net accumulation in CHF by non-commercials.
CHF seen as a safe haven currency in times of macro uncertainty.
✔️ Big player positioning confirms short.
7. Fundamental and macroeconomic analysis
GBP weakened by persistent inflation and neutral BoE outlook.
CHF supported by conservative SNB policy.
✔️ Fundamental scenario favors short.
8. Implied and historical volatility
Volatility compression in progress → potential imminent directional explosion.
✔️ Optimal technical timing.
9. Pattern Backtesting
Similar patterns on GBP/CHF have shown 78% success.
Average time to target: 6–9 days.
✔️ High historical confidence.
10. Confirmation with AI models
GAN model and Prophet confirm short directionality with 84% probability.
✔️ AI in alignment.
11. Real-time data updates
All information is updated as of May 21, 2025, 15:34 UTC+2.
✔️ Analysis based on fresh and accurate data.
12. Historical study (last 50 years)
Forced bull phases on GBP/CHF followed by medium-term corrections are common in UK-Swiss economic cycles.
✔️ Consistent historical pattern.

Bullish bounce off 38.2% Fibonacci support?GBP/AUD is falling towards the support level which is a pullback support that lines up with the 38.2% Fibonacci retracement and could bounce from this level to our take profit.
Entry: 2.0762
Why we like it:
There is a pullback support level that lines up with the 38.2% Fibonacci retracement.
Stop loss: 2.0655
Why we lik eit:
There is a pullback support level that lines up with the 61.8% Fibonacci retracement.
Take profit: 2.0999
Why we like it:
There is a pullback resistance level that aligns with the 100% Fibonacci projection.
Enjoying your TradingView experience? Review us!
Please be advised that the information presented on TradingView is provided to Vantage (‘Vantage Global Limited’, ‘we’) by a third-party provider (‘Everest Fortune Group’). Please be reminded that you are solely responsible for the trading decisions on your account. There is a very high degree of risk involved in trading. Any information and/or content is intended entirely for research, educational and informational purposes only and does not constitute investment or consultation advice or investment strategy. The information is not tailored to the investment needs of any specific person and therefore does not involve a consideration of any of the investment objectives, financial situation or needs of any viewer that may receive it. Kindly also note that past performance is not a reliable indicator of future results. Actual results may differ materially from those anticipated in forward-looking or past performance statements. We assume no liability as to the accuracy or completeness of any of the information and/or content provided herein and the Company cannot be held responsible for any omission, mistake nor for any loss or damage including without limitation to any loss of profit which may arise from reliance on any information supplied by Everest Fortune Group.

GBPUSD needs a catalyst. Could UK inflation be that?For now, FX_IDC:GBPUSD is struggling to overcome a key resistance barrier, at around 1.3440. Could the UK inflation numbers help move the pair?
Let's dig in...
MARKETSCOM:GBPUSD
Let us know what you think in the comments below.
Thank you.
77.3% of retail investor accounts lose money when trading CFDs with this provider. You should consider whether you understand how CFDs work and whether you can afford to take the high risk of losing your money. Past performance is not necessarily indicative of future results. The value of investments may fall as well as rise and the investor may not get back the amount initially invested. This content is not intended for nor applicable to residents of the UK. Cryptocurrency CFDs and spread bets are restricted in the UK for all retail clients.

GBP/USD Retracement or Reversal? Stay Sharp as Momentum FadesGBP/USD Trading Plan – May 20th | Retracement or Reversal? Stay Sharp as Momentum Fades
🌐 Macro Overview
GBP/USD is currently influenced by several macroeconomic forces:
USD strength is returning, supported by stable US data (Retail Sales, Jobless Claims), leading the market to delay expectations of a Fed rate cut.
The British Pound is under pressure as the Bank of England (BoE) is not expected to raise rates further amid slowing domestic growth and easing inflation.
Simultaneously, US-China trade tensions and US debt concerns are keeping market sentiment cautious. The pair is forming a bullish flag structure, but signs of exhaustion are emerging.
📉 Technical Analysis (2H Chart)
GBP/USD is moving within a rising channel. However:
1.3433 remains a strong resistance, aligning with a local top — breakout potential is limited in the short term.
A rising wedge pattern is forming — watch for a potential trap followed by a sharp sell-off.
EMA13 and EMA34 are diverging, signaling distribution and potential reversal ahead.
🔑 Key Levels to Watch
Major Resistance:
🔺 1.3433 – recent swing high and potential double top
🔺 1.3355 – mid-range resistance and EMA34 convergence (H2)
Key Support:
🔻 1.3303 – key FIBO + trendline intersection
🔻 1.3251 – medium-term bullish structure support
🔻 1.3174 – previous swing low and strategic BUY ZONE
🎯 Trading Scenarios
📍 Scenario A – False Break and Rejection from Resistance
Entry (SELL): 1.3430 – 1.3433 (after bearish confirmation)
Stop Loss: 1.3460
Take Profits: 1.3355 → 1.3303 → 1.3250
📍 Scenario B – Breakdown and Failed Retest
Entry (SELL): 1.3303 – 1.3310 (after support break and retest)
Stop Loss: 1.3340
Take Profits: 1.3251 → 1.3174
📍 Scenario C – Deep Buy from Strong Support
Entry (BUY): 1.3170 – 1.3174
Stop Loss: 1.3140
Take Profits: 1.3251 → 1.3300
⚠️ Key Reminders:
Stay cautious ahead of key US releases this week (PMI, FOMC Minutes), which may trigger high volatility.
Avoid FOMO and respect SL/TP discipline — especially near potential trap zones.
📌 Follow for intraday updates and real-time trade setups as the structure evolves. Flexibility is key in this market.

Bullish bounce for the Cable?The price is falling towards the pivot which is a pullback support and could bounce to the 1st resistance.
Pivot: 1.3323
1st Support: 1.3275
1st Resistance: 1.3402
Risk Warning:
Trading Forex and CFDs carries a high level of risk to your capital and you should only trade with money you can afford to lose. Trading Forex and CFDs may not be suitable for all investors, so please ensure that you fully understand the risks involved and seek independent advice if necessary.
Disclaimer:
The above opinions given constitute general market commentary, and do not constitute the opinion or advice of IC Markets or any form of personal or investment advice.
Any opinions, news, research, analyses, prices, other information, or links to third-party sites contained on this website are provided on an "as-is" basis, are intended only to be informative, is not an advice nor a recommendation, nor research, or a record of our trading prices, or an offer of, or solicitation for a transaction in any financial instrument and thus should not be treated as such. The information provided does not involve any specific investment objectives, financial situation and needs of any specific person who may receive it. Please be aware, that past performance is not a reliable indicator of future performance and/or results. Past Performance or Forward-looking scenarios based upon the reasonable beliefs of the third-party provider are not a guarantee of future performance. Actual results may differ materially from those anticipated in forward-looking or past performance statements. IC Markets makes no representation or warranty and assumes no liability as to the accuracy or completeness of the information provided, nor any loss arising from any investment based on a recommendation, forecast or any information supplied by any third-party.

Bullish bounce off 50% Fibonacci support?GBP/USD is falling towards the support level which is a pullback support that lines up with the 50% Fibonacci retracement and could bounce from this level to our take profit.
Entry: 1.3326
Why we like it:
There is a pullback support level that lines up with the 50% Fibonacci retracement.
Stop loss: 1.3293
Why we like it:
There is an overlap support level that is slightly above the 78.6% Fibonacci retracement.
Take profit: 1.3395
Why we like it:
There is a pullback resistance.
Enjoying your TradingView experience? Review us!
Please be advised that the information presented on TradingView is provided to Vantage (‘Vantage Global Limited’, ‘we’) by a third-party provider (‘Everest Fortune Group’). Please be reminded that you are solely responsible for the trading decisions on your account. There is a very high degree of risk involved in trading. Any information and/or content is intended entirely for research, educational and informational purposes only and does not constitute investment or consultation advice or investment strategy. The information is not tailored to the investment needs of any specific person and therefore does not involve a consideration of any of the investment objectives, financial situation or needs of any viewer that may receive it. Kindly also note that past performance is not a reliable indicator of future results. Actual results may differ materially from those anticipated in forward-looking or past performance statements. We assume no liability as to the accuracy or completeness of any of the information and/or content provided herein and the Company cannot be held responsible for any omission, mistake nor for any loss or damage including without limitation to any loss of profit which may arise from reliance on any information supplied by Everest Fortune Group.

GBP/CAD - Triangle Breakout (19.05.2025)The GBP/CAD pair on the M30 timeframe presents a Potential Buying Opportunity due to a recent Formation of a Triangle Pattern. This suggests a shift in momentum towards the upside and a higher likelihood of further advances in the coming hours.
Possible Long Trade:
Entry: Consider Entering A Long Position around Trendline Of The Pattern.
Target Levels:
1st Resistance – 1.8651
2nd Resistance – 1.8685
🎁 Please hit the like button and
🎁 Leave a comment to support for My Post !
Your likes and comments are incredibly motivating and will encourage me to share more analysis with you.
Best Regards, KABHI_TA_TRADING
Thank you.
Disclosure: I am part of Trade Nation's Influencer program and receive a monthly fee for using their TradingView charts in my analysis.

GBP/USD - Triangle Breakout (16.05.2025)The GBP/USD pair on the M30 timeframe presents a Potential Buying Opportunity due to a recent Formation of a Triangle Breakout Pattern. This suggests a shift in momentum towards the upside and a higher likelihood of further advances in the coming hours.
Possible Long Trade:
Entry: Consider Entering A Long Position around Trendline Of The Pattern.
Target Levels:
1st Resistance – 1.3389
2nd Resistance – 1.3441
🎁 Please hit the like button and
🎁 Leave a comment to support for My Post !
Your likes and comments are incredibly motivating and will encourage me to share more analysis with you.
Best Regards, KABHI_TA_TRADING
Thank you.

Bearish reversal off pullback resistance?The Cable (GBP/USD) is rising towards the pivot which is a pullback resistance and could reverse to the 1st support which acts as a pullback support.
Pivot: 1.3434
1st Support: 1.3100
1st Resistance: 1.3767
Risk Warning:
Trading Forex and CFDs carries a high level of risk to your capital and you should only trade with money you can afford to lose. Trading Forex and CFDs may not be suitable for all investors, so please ensure that you fully understand the risks involved and seek independent advice if necessary.
Disclaimer:
The above opinions given constitute general market commentary, and do not constitute the opinion or advice of IC Markets or any form of personal or investment advice.
Any opinions, news, research, analyses, prices, other information, or links to third-party sites contained on this website are provided on an "as-is" basis, are intended only to be informative, is not an advice nor a recommendation, nor research, or a record of our trading prices, or an offer of, or solicitation for a transaction in any financial instrument and thus should not be treated as such. The information provided does not involve any specific investment objectives, financial situation and needs of any specific person who may receive it. Please be aware, that past performance is not a reliable indicator of future performance and/or results. Past Performance or Forward-looking scenarios based upon the reasonable beliefs of the third-party provider are not a guarantee of future performance. Actual results may differ materially from those anticipated in forward-looking or past performance statements. IC Markets makes no representation or warranty and assumes no liability as to the accuracy or completeness of the information provided, nor any loss arising from any investment based on a recommendation, forecast or any information supplied by any third-party.

EURGBP | A Shift in Market Dynamics: GBP to Gain StrengthThe current environment, driven by increasing uncertainty in the dollar, presents a unique opportunity in the EURGBP trading pair. With the Eurozone having lowered interest rates, the euro has gained value somewhat unnecessarily, largely in response to some of the illogical market moves we've seen from the Trump era. However, as the volatility from such unpredictable actions settles down, the British pound (GBP) will likely make a comeback.
📉 Euro's Overvaluation and GBP's Stability
While the Euro has benefited from these external factors, its recent strength is arguably not reflective of the underlying economic realities. On the other hand, the British pound has maintained stability with consistent interest rates. This relative calmness has allowed GBP to gain strength against the euro over time.
📈 GBP Will Play Catch-Up
As we move forward, the GBP is poised to compensate for its recent underperformance. The Bank of England's steady approach to interest rates will provide a solid foundation for the pound to regain lost ground. In contrast, the euro may struggle to sustain its current levels, particularly with the potential risks surrounding further economic policies in the Eurozone.
🔍 Trade Strategy for EURGBP
As a trader, I see EURGBP as a clear short opportunity, with the pound likely to outperform the euro in the near-term. Patience is key here, as waiting for the right technical setup, especially on the lower timeframes, will allow you to enter with confirmation.
💡 Why This Matters
The shifts in these two economies — one facing potential fallout from low rates and the other benefiting from a more stable policy environment — create an optimal setup for taking advantage of currency movements. Just as in any trade, follow the clear path where value has been mispriced and capitalize on that gap.
Stay informed and be ready to act when these market conditions play out — because this opportunity might not last long.
📌I keep my charts clean and simple because I believe clarity leads to better decisions.
📌My approach is built on years of experience and a solid track record. I don’t claim to know it all but I’m confident in my ability to spot high-probability setups.
📌If you would like to learn how to use the heatmap, cumulative volume delta and volume footprint techniques that I use below to determine very accurate demand regions, you can send me a private message. I help anyone who wants it completely free of charge.
🔑I have a long list of my proven technique below:
🎯 ZENUSDT.P: Patience & Profitability | %230 Reaction from the Sniper Entry
🐶 DOGEUSDT.P: Next Move
🎨 RENDERUSDT.P: Opportunity of the Month
💎 ETHUSDT.P: Where to Retrace
🟢 BNBUSDT.P: Potential Surge
📊 BTC Dominance: Reaction Zone
🌊 WAVESUSDT.P: Demand Zone Potential
🟣 UNIUSDT.P: Long-Term Trade
🔵 XRPUSDT.P: Entry Zones
🔗 LINKUSDT.P: Follow The River
📈 BTCUSDT.P: Two Key Demand Zones
🟩 POLUSDT: Bullish Momentum
🌟 PENDLEUSDT.P: Where Opportunity Meets Precision
🔥 BTCUSDT.P: Liquidation of Highly Leveraged Longs
🌊 SOLUSDT.P: SOL's Dip - Your Opportunity
🐸 1000PEPEUSDT.P: Prime Bounce Zone Unlocked
🚀 ETHUSDT.P: Set to Explode - Don't Miss This Game Changer
🤖 IQUSDT: Smart Plan
⚡️ PONDUSDT: A Trade Not Taken Is Better Than a Losing One
💼 STMXUSDT: 2 Buying Areas
🐢 TURBOUSDT: Buy Zones and Buyer Presence
🌍 ICPUSDT.P: Massive Upside Potential | Check the Trade Update For Seeing Results
🟠 IDEXUSDT: Spot Buy Area | %26 Profit if You Trade with MSB
📌 USUALUSDT: Buyers Are Active + %70 Profit in Total
🌟 FORTHUSDT: Sniper Entry +%26 Reaction
🐳 QKCUSDT: Sniper Entry +%57 Reaction
📊 BTC.D: Retest of Key Area Highly Likely
📊 XNOUSDT %80 Reaction with a Simple Blue Box!
📊 BELUSDT Amazing %120 Reaction!
I stopped adding to the list because it's kinda tiring to add 5-10 charts in every move but you can check my profile and see that it goes on..

GBPJPY - Bullish No More!Hello TradingView Family / Fellow Traders. This is Richard, also known as theSignalyst.
📈As per our last GBPJPY analysis (attached on the chart), it rejected the lower bound of the rising blue channel.
What's next?
GBPJPY is currently approaching the upper bound of its falling trend marked in red.
Moreover, the green zone is a strong structure and resistance.
🏹 Thus, the highlighted red circle is a strong area to look for sell setups as it is the intersection of structure and upper red trendline acting as a non-horizontal resistance.
📚 As per my trading style:
As #GBPJPY approaches the red circle zone, I will be looking for bearish reversal setups (like a double top pattern, trendline break , and so on...)
📚 Always follow your trading plan regarding entry, risk management, and trade management.
Good luck!
All Strategies Are Good; If Managed Properly!
~Rich
Disclosure: I am part of Trade Nation's Influencer program and receive a monthly fee for using their TradingView charts in my analysis.

Could the Cable drop from here?The price is rising towards the pivot that lines up with the 78.6% Fibonacci retracement and could drop to the 1st support which is an overlap support.
Pivot: 1.3339
1st Support: 1.3158
1st Resistance: 1.3442
Risk Warning:
Trading Forex and CFDs carries a high level of risk to your capital and you should only trade with money you can afford to lose. Trading Forex and CFDs may not be suitable for all investors, so please ensure that you fully understand the risks involved and seek independent advice if necessary.
Disclaimer:
The above opinions given constitute general market commentary, and do not constitute the opinion or advice of IC Markets or any form of personal or investment advice.
Any opinions, news, research, analyses, prices, other information, or links to third-party sites contained on this website are provided on an "as-is" basis, are intended only to be informative, is not an advice nor a recommendation, nor research, or a record of our trading prices, or an offer of, or solicitation for a transaction in any financial instrument and thus should not be treated as such. The information provided does not involve any specific investment objectives, financial situation and needs of any specific person who may receive it. Please be aware, that past performance is not a reliable indicator of future performance and/or results. Past Performance or Forward-looking scenarios based upon the reasonable beliefs of the third-party provider are not a guarantee of future performance. Actual results may differ materially from those anticipated in forward-looking or past performance statements. IC Markets makes no representation or warranty and assumes no liability as to the accuracy or completeness of the information provided, nor any loss arising from any investment based on a recommendation, forecast or any information supplied by any third-party.

Bearish drop?GBP/USD has reacted off the resistance level which is a pullback resistance that aligns with the 61.8% Fibonacci retracement and could drop from this level to our take profit.
Entry: 1.3317
Why we like it:
There is a pullback resistance level that lines up with the 61.8% Fibonacci retracement.
Stop loss: 1.3368
Why we like it:
There is a pullback resistance level.
Take profit: 1.3200
Why we like it:
There is a pullback support level that lines up with the 71% Fibonacci retracement.
Enjoying your TradingView experience? Review us!
Please be advised that the information presented on TradingView is provided to Vantage (‘Vantage Global Limited’, ‘we’) by a third-party provider (‘Everest Fortune Group’). Please be reminded that you are solely responsible for the trading decisions on your account. There is a very high degree of risk involved in trading. Any information and/or content is intended entirely for research, educational and informational purposes only and does not constitute investment or consultation advice or investment strategy. The information is not tailored to the investment needs of any specific person and therefore does not involve a consideration of any of the investment objectives, financial situation or needs of any viewer that may receive it. Kindly also note that past performance is not a reliable indicator of future results. Actual results may differ materially from those anticipated in forward-looking or past performance statements. We assume no liability as to the accuracy or completeness of any of the information and/or content provided herein and the Company cannot be held responsible for any omission, mistake nor for any loss or damage including without limitation to any loss of profit which may arise from reliance on any information supplied by Everest Fortune Group.
