GBPAUD Reverses from Key Zone – Long Setup in Play!Today I want to share with you a Long position on GBPAUD ( OANDA:GBPAUD ).
GBPAUD started to rise well from the Important Support line , Support zone(2.032 AUD-1.987 AUD) , and Potential Reversal Zone(PRZ) and managed to close the 4-hour candle above 2.053 AUD (important) .
In terms of Elliott wave theory , GBPAUD seems to have completed the main wave 4 . The main wave 4 structure was a Double Three Correction(WXY) .
Also, along the way, we can see a Bullish Marubozu candle , which could indicate a continuation of the uptrend .
I expect GBPAUD to break the Resistance lines soon and attack the Resistance zone(2.078 AUD-2.066 AUD) .
First Target: 2.065 AUD
Second Target: 2.076 AUD
Note: Stop Loss(SL): 2.040 =Worst SL
Please respect each other's ideas and express them politely if you agree or disagree.
British Pound/ Australian Dollar Analyze (GBPAUD), 4-hour time frame.
Be sure to follow the updated ideas.
Do not forget to put a Stop loss for your positions (For every position you want to open).
Please follow your strategy and updates; this is just my Idea, and I will gladly see your ideas in this post.
Please do not forget the ✅' like '✅ button 🙏😊 & Share it with your friends; thanks, and Trade safe.
Gbpaudanalysis
GBPAUD is Holding above the Support , All Eyes on BuyingHello Traders
In This Chart GBPAUD HOURLY Forex Forecast By FOREX PLANET
today GBPAUD analysis 👆
🟢This Chart includes_ (GBPAUD market update)
🟢What is The Next Opportunity on GBPJPY Market
🟢how to Enter to the Valid Entry With Assurance Profit
This CHART is For Trader's that Want to Improve Their Technical Analysis Skills and Their Trading By Understanding How To Analyze The Market Using Multiple Timeframes and Understanding The Bigger Picture on the Charts
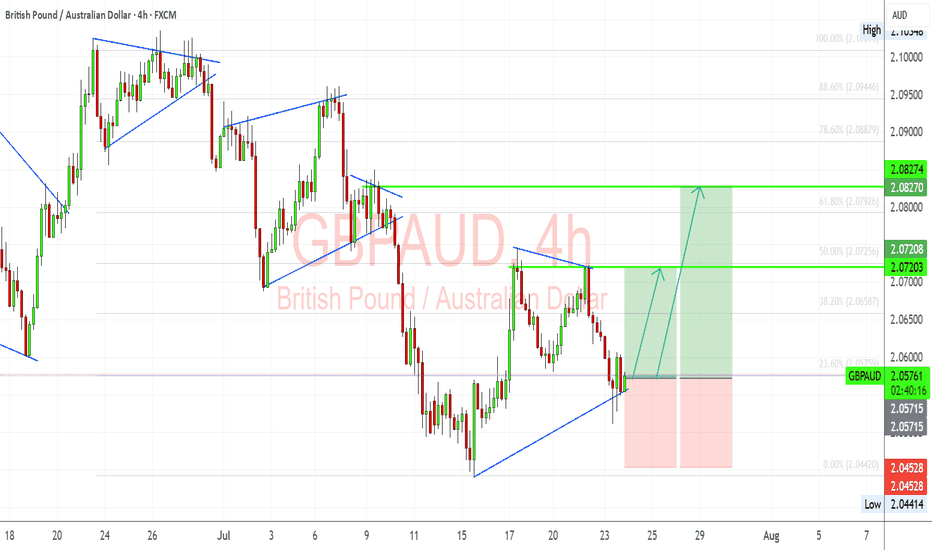
GBP/AUD Trade Setup – Bullish Flag Breakout in PlayGBPAUD has formed a clean bullish flag structure after a significant impulsive move upward. Following the correction, we’re now testing breakout levels with clear Fibonacci confluence and bullish structure support around 2.0560. I'm anticipating a push toward the next resistance levels if buyers defend this trendline.
🔎 Technical Highlights (My View):
Bullish Flag Pattern: The corrective flag has broken to the upside and is being retested. This suggests a possible continuation of the bullish trend.
Fibonacci Support: Price bounced near the 23.6% retracement of the previous bullish leg, which acts as a minor but effective support in trending moves.
Bullish Trendline Holding: The ascending trendline from the July lows continues to act as dynamic support. This shows sustained buyer interest.
Target Zones:
TP1: 2.0720 – aligns with 50% retracement and recent structure.
TP2: 2.0827 – aligns with 78.6% retracement and past resistance.
SL: Below 2.0450 to invalidate the setup.
🏦 Fundamental Context:
GBP Strength: The Bank of England remains more hawkish than the RBA. UK inflation data remains sticky, and traders are still pricing in the potential for another hike if services inflation remains elevated.
AUD Weakness: AUD is under pressure due to soft labor market data and declining commodity demand from China. RBA minutes also struck a cautious tone, which weighs on the Aussie.
China Risk: AUD is sensitive to Chinese sentiment. Current trade and tariff tensions are adding indirect bearish pressure to the AUD.
⚠️ Risks to My Setup:
If Aussie labor or CPI data surprises to the upside, AUD could regain strength.
UK economic data deterioration (e.g., services PMI, wage inflation) could weaken GBP.
Break below 2.0450 would invalidate the bullish setup and suggest potential range continuation.
📅 Upcoming Catalysts to Watch:
UK Retail Sales – A strong print supports GBP continuation.
AU CPI (Trimmed Mean) – Any upside surprise could limit AUD downside.
China Industrial & Services PMI (if released soon) – indirect AUD mover.
⚖️ Summary – Bias & Trade Logic
I’m currently bullish GBP/AUD, expecting a continuation of the prior uptrend now that price has broken and retested the flag structure. Fundamentally, GBP is supported by relatively hawkish BoE expectations, while AUD remains pressured by RBA caution and China-linked macro weakness. My bias stays bullish as long as the trendline holds and Aussie data doesn’t surprise significantly.
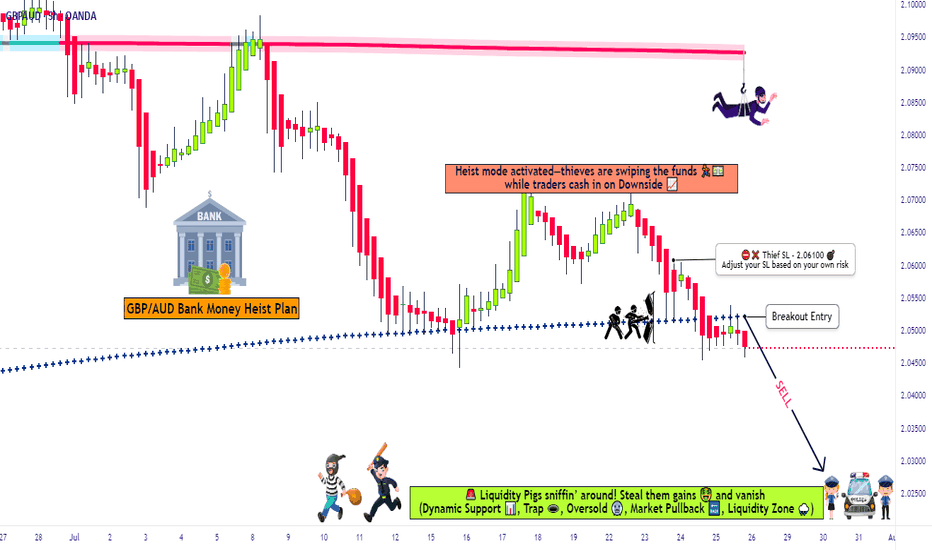
High-Stakes GBP/AUD Short Plan – Grab the Bag & Escape Early!💥🔥GBP/AUD HEIST OPERATION: The Pound vs Aussie Bear Trap Masterplan 🔥💥
(Thief Trader Exclusive TradingView Drop – Smash Boost If You’re Ready To Rob The Market!)
🌍 Hi! Hola! Ola! Bonjour! Hallo! Marhaba! 🌍
Welcome, Money Makers & Market Robbers! 🤑💰✈️
This isn't just analysis — it's a high-stakes forex heist, engineered using Thief Trading Style's elite blend of technical, macro, sentiment, and quantitative insights. We're cracking the GBP/AUD vault with sharp bearish setups targeting a major liquidity zone — aka the Police Barricade Support Area! 🚨🔫
📉 Plan of Attack – Short Entry Setup
This isn’t your typical chart — this is blueprint-grade precision. Here's the GBP/AUD short strategy for Day & Swing Traders:
🚪 ENTRY ZONE
Initiate bearish positions at or near recent highs (wick level).
Use limit orders stacked (layering/DCA style) on the 15m or 30m retest zones for sniper entries.
Look for wicks with rejection — that’s where the fake bullish robbers get trapped!
🛑 STOP LOSS
Place SL just above recent 4H swing highs (2.06100 as a reference).
Adjust according to position size and the number of orders you’re layering.
🎯 TARGET ZONE
Aim for 2.02500, or book partial profits earlier if the heist gets heat.
Escape before the alarms ring! Secure the bag and vanish like a pro.
🔍Fundamental & Sentiment Heist Intel 📚
This bearish pressure on GBP/AUD isn’t random — it’s triggered by a perfect storm:
COT Positioning flips 📊
Aussie strength from commodities & RBA commentary 📈
GBP uncertainty from macro tightening & economic data ⚖️
Sentiment exhaustion at highs + false bullish trap 📉
Consolidation zone breakdown = smart money move! 💼
Wanna go deep? 🧠
Tap into COT, Macro Trends, Intermarket Analysis & Thief’s proprietary scoreboardsss 📡🔗
⚠️ News & Position Management Alert 🚧
📰 Avoid entry around key news drops
🔒 Lock in profits with trailing SL
💼 Secure capital > Chase greed
🔥 SHOW SOME LOVE 🔥
💖 Smash that ❤️ BOOST button — it powers our next big heist!
Together, we rob the market with style, skill, and precision.
See you on the next breakout robbery mission, legends!
Stay dangerous. Stay profitable. Stay Thief. 🐱👤💵🚀
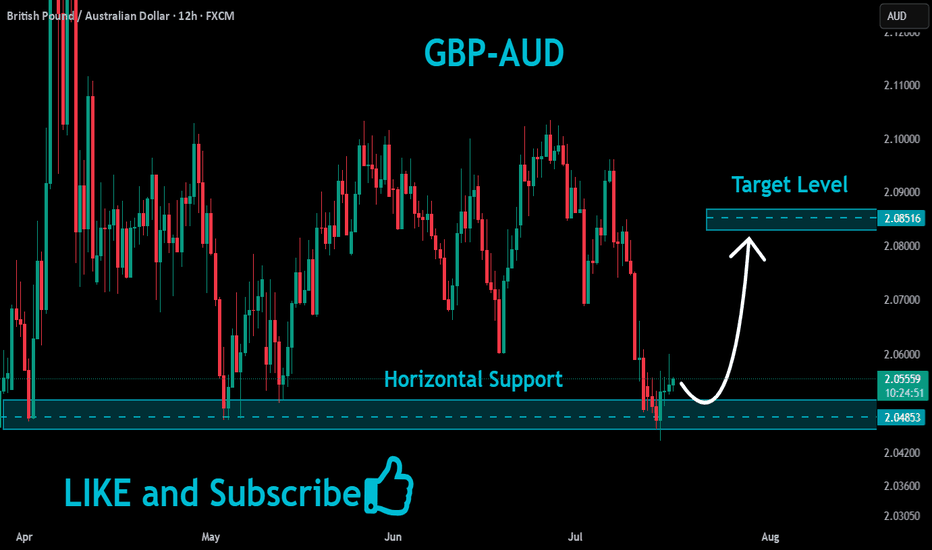
GBPAUD BUY SIGNAL. Don't forget about stop-loss.
Write in the comments all your questions and instruments analysis of which you want to see.
Friends, push the like button, write a comment, and share with your mates - that would be the best THANK YOU.
P.S. I personally will open entry if the price will show it according to my strategy.
Always make your analysis before a trade
GBP/AUD Ready To Go Up After Melted , 2 Entries Valid !Here is my GBP/AUD 1H Chart and this is my opinion , the price moved very hard to downside without any correction and the price at strong support now 2.05000 which is forced the price many times to go up , so it`s my best place to enter a buy trade , and if you checked the chart you will see the price now creating a reversal pattern and i put my neckline and if we have a closure above it to confirm the pattern we can enter another entry to increase our contracts . if we have a daily closure below my support area then this idea will not be valid anymore .
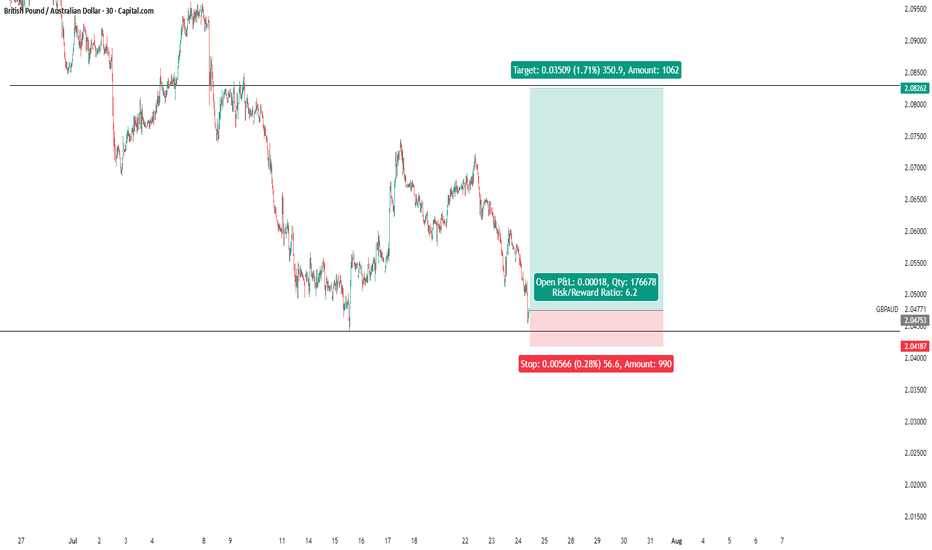
GBP/AUD Tests 2.048 for Potential ReboundFenzoFx—GBP/AUD is testing the critical support level at 2.048, coinciding with the VWAP. From a technical perspective, a bullish move toward an upper resistance level is likely.
In this scenario, GBP/AUD has the potential to test the bearish FVG at approximately 2.070. Please note that the bullish outlook should be invalidated if GBP/AUD falls and stabilizes below 2.048.
Will This Breakout Unlock the Money Run? GBP/AUD Heist Begins!💼The Pound Heist: GBP/AUD Break-In Blueprint🔐
“The vault’s half open… Are you in or watching from the cameras?”
🌍 Hey crew! 💬 Hola, Ola, Bonjour, Hallo, Marhaba! 🌟
Welcome to another sneaky setup from the Thief Trading Syndicate™ 🕵️♂️💸
We're setting our sights on GBP/AUD — and the market's flashing green for a bold long entry mission. Read the plan carefully before suiting up. 🎯
🧠 Mission Brief:
The “Pound vs Aussie” market is now playing around a key resistance wall – it’s hot, it’s risky, and it’s primed for a breakout 🎇.
🟢 Entry:
Break & Close Above 2.10500 = 🚨 Green Light
🎯 Set a Buy Stop above the resistance zone —
OR
Sneak in with a Buy Limit during a clean pullback to recent high/low on the 15m or 30m timeframes 🔍.
⏰ Set an alert, don’t miss the moment the vault cracks open.
🛡️ Stop Loss Plan – Lock Your Exit:
🛑 For Buy Stops:
➡️ Wait till the breakout confirms — don’t rush your SL like a rookie 🐣
📍 Suggested SL at swing low (2.08700) based on the 3H timeframe
💡 Always size your SL based on your risk tolerance, not just the setup.
🎯 The Escape Plan – Target:
🏁 First Checkpoint: 2.13000
📤 Or slip out early if you sense heavy guards (resistance) on duty.
Use Trailing SL to lock your loot while staying in the run.
🧲 Scalper's Note:
Only rob the bullish side! If you’re packing heavy funds, hit fast — else join the swing crew and move with caution. 🎒
Lock in profits with trailing exits to avoid being caught in the chop 🌀.
📊 Why This Heist Works – Market Fuel:
🔥 Bullish sentiment fueled by:
Technical setup (Resistance > Breakout > Momentum Surge)
Risk zone analysis
Macro & COT outlooks
Sentiment + Intermarket Alignment
Stay informed — read the full macro game plan, news, and positioning tools. Knowledge = clean escape. 🧠💼
📰 News Alert:
⚠️ Avoid new entries during high-volatility events
✅ Use trailing SLs to protect any active trades
🔐 Stay safe, stay sharp — the market’s watching too 👁️
🆙 Support the Crew:
Smash the 💥 Boost Button 💥 if you ride with the Thief Style Traders 🐱👤💸
Let’s continue bagging pips & stacking gold, one chart at a time.
🚀 Next mission drops soon. Stay sharp. Stay sneaky. Stay paid.
#ThiefTrading #ForexHeist #GBPAUDPlan
GBPAUD neutral - 9th July 2025This is my detailed multi-timeframe analysis for GBPAUD, based on the prevailing market structure, key liquidity zones, and candlestick behaviour.
Quarterly Timeframe:
On the three-month timeframe, price recently reached a significant liquidity region around 2.1600. From this level, the market has attracted substantial bearish orders, as evidenced by the recent quarterly candlestick, which closed relatively bearish. This suggests that bullish momentum has weakened considerably at these highs. Consequently, I expect that additional bearish orders may continue to enter the market, leading to a moderate retracement in the coming quarters.
Monthly Timeframe:
On the monthly chart, while price rejected the major liquidity region at 2.1600, the subsequent monthly candles have shown some signs of bullish intent, as indicated by wicks forming higher highs and higher lows. However, the candlestick bodies reveal an overall lack of follow-through, implying indecision in the market.
June’s monthly candle closed relatively bearish and indecisive, which may suggest that price is currently accumulating orders to fuel its next significant move. My current intuition leans towards a potential continuation higher, provided that price action confirms this bias. Notably, June’s candle could be interpreted as a potential order block, suggesting the possibility of price filling orders for a bullish move.
Nevertheless, the presence of a textbook ‘W’ formation must be acknowledged. The bearish close in June may imply a retest of the neckline around the 2.0300 level. Should bearish confirmations appear, this scenario could unfold in the medium term.
Weekly Timeframe:
The weekly timeframe indicates that price has been consolidating for the past five weeks. This choppy, indecisive price action makes the structure more challenging to interpret with conviction. The base of this consolidation zone sits around 2.0825; a clear weekly close below this level could present a case for bearish continuation, contingent on supporting confluences. At present, my bias on the weekly timeframe remains neutral given the lack of a clear directional signal.
Daily Timeframe:
On the daily chart, the market showed notable bearish activity in the previous session, closing below the key 2.0880 region. The next significant liquidity area to watch lies around 2.0700. My short-term bias for the day is bearish, and I anticipate that price may move towards this region. However, I do not regard this as a high-probability setup, so caution is warranted.
4-Hour Timeframe:
The 4-hour timeframe offers little additional clarity beyond the observation that price absorbed considerable bearish orders around the 2.0950 level. If price closes above the 2.0838 level, I will consider a short-term long position targeting the daily liquidity region at 2.0880. Overall, my stance on the 4-hour chart is largely neutral until more decisive price action emerges.
Disclaimer:
This analysis is intended for informational and educational purposes only. It does not constitute financial advice. Please conduct your own research and apply sound risk management before entering any trades.
GBPAUD Selling Trading IdeaHello Traders
In This Chart GBP/AUD 4 HOURLY Forex Forecast By FOREX PLANET
today GBP/AUD analysis 👆
🟢This Chart includes_ (GBP/AUD market update)
🟢What is The Next Opportunity on GBP/AUD Market
🟢how to Enter to the Valid Entry With Assurance Profit
This CHART is For Trader's that Want to Improve Their Technical Analysis Skills and Their Trading By Understanding How To Analyze The Market Using Multiple Timeframes and Understanding The Bigger Picture on the Charts
GBPAUD Short From Resistance!
HI,Traders !
#GBPAUD went up sharply
Made a retest of the
Horizontal resistance level
Of 2.10010 from where we
Are already seeing a local
Bearish reaction so we
Are locally bearish biased
And we will be expecting
A local bearish correction !
Comment and subscribe to help us grow !
gbpaud sell signal. Don't forget about stop-loss.
Write in the comments all your questions and instruments analysis of which you want to see.
Friends, push the like button, write a comment, and share with your mates - that would be the best THANK YOU.
P.S. I personally will open entry if the price will show it according to my strategy.
Always make your analysis before a trade
gbpaud buy signal. Don't forget about stop-loss.
Write in the comments all your questions and instruments analysis of which you want to see.
Friends, push the like button, write a comment, and share with your mates - that would be the best THANK YOU.
P.S. I personally will open entry if the price will show it according to my strategy.
Always make your analysis before a trade
GBPAUD - Expecting Bearish Continuation In The Short TermM15 - Bearish divergence followed by the most recent uptrend line breakout.
Clean bearish trend with the price creating series of lower highs, lower lows.
No opposite signs.
Expecting further continuation lower until the two Fibonacci resistance zones hold.
If you enjoy this idea, don’t forget to LIKE 👍, FOLLOW ✅, SHARE 🙌, and COMMENT ✍! Drop your thoughts and charts below to keep the discussion going. Your support helps keep this content free and reach more people! 🚀
--------------------------------------------------------------------------------------------------------------------
gbpaud buy signal. Don't forget about stop-loss.
Write in the comments all your questions and instruments analysis of which you want to see.
Friends, push the like button, write a comment, and share with your mates - that would be the best THANK YOU.
P.S. I personally will open entry if the price will show it according to my strategy.
Always make your analysis before a trade
gbpjpy buy signal. Don't forget about stop-loss.
Write in the comments all your questions and instruments analysis of which you want to see.
Friends, push the like button, write a comment, and share with your mates - that would be the best THANK YOU.
P.S. I personally will open entry if the price will show it according to my strategy.
Always make your analysis before a trade
GBPAUD buy Trade IdeaHello Traders
In This Chart GBP/AUD 4 HOURLY Forex Forecast By FOREX PLANET
today GBP/AUD analysis 👆
🟢This Chart includes_ (GBP/AUD market update)
🟢What is The Next Opportunity on GBP/AUD Market
🟢how to Enter to the Valid Entry With Assurance Profit
This CHART is For Trader's that Want to Improve Their Technical Analysis Skills and Their Trading By Understanding How To Analyze The Market Using Multiple Timeframes and Understanding The Bigger Picture on the Charts
GBPAUD Wave Analysis: Is a Rally to 2.13677 on the Horizon?Hey Realistic Traders!
Can $OANDA: GBPAUD Keep the Bull Run Alive? Let’s Break It Down...
Trend Analysis
On the H4 timeframe, GBPAUD has broken out of a double bottom pattern, signaling a shift from a short-term bearish trend to a bullish one. Bullish momentum is further confirmed by price action trading above the EMA-200 line. On the higher timeframe, a falling wedge breakout pattern supports the bullish continuation scenario, aligning with the broader wave structure.
Wave Analysis
Applying Elliott Wave theory, the recent price action suggests the completion of Wave 2 around the 0.786 Fibonacci retracement level, aligning with the neckline breakout of the double bottom pattern. The potential formation of Wave 3, typically the strongest and most impulsive wave, targets 2.10265 as the first extension level with a further extension to 2.13677, calculated using Fibonacci extensions of the current bullish wave.
The outlook remains valid as long as the price stays above the key stop-loss level at 2.04774, invalidating the Wave 3 setup if breached.
Support the channel by engaging with the content, using the rocket button, and sharing your opinions in the comments below.
Disclaimer: "Please note that this analysis is solely for educational purposes and should not be considered a recommendation to take a long or short position on GBPAUD.
#GBPAUD: Will price reverse to bullish, or continue dropping? GBPAUD fell further below our expectations in our previous analysis, but the price remains extremely bearish. GBP failed to hold on to its bullish momentum, leading the pair to drop 300 pips from our previous entry zone. Currently, price is trading at a key buying level, where we can expect a strong bullish volume to kick in the market and help us gain a nice clean bullish move. There are two areas for both entries. At the moment, you can use a small time frame to take any swing buy entry. Please ensure you manage your risk accurately before getting into the market.
Good luck and trade safely!
Thank you for your unwavering support! 😊
If you’d like to contribute, here are a few ways you can help us:
- Like our ideas
- Comment on our ideas
- Share our ideas
Team Setupsfx_
❤️🚀


