GBPCAD |LONG its been a full month and a few weeks since we entered any trades, as due to the war.
But we now ready. i have alot more coming to hold for the following 2 weeks for us to hold.
HAPPY TRADING TRADERS
Gbpaudlong

GBPAUD | LONG
its been a full month and a few weeks since we entered any trades, as due to the war.
But we now ready. i have alot more coming to hold for the following 2 weeks for us to hold.
HAPPY TRADING TRADERS


GBPAUD | BREAKOUTGBPAUD after completing our cup and handle target (watch last update), has bounced from parallel channel support and manages to break above the channel. We are bullish as long as it is trading above the breakout level.
Trade your levels accordingly.

GBP AUD Bullishthe price trading in a descending channel more than two months now it broke with a price go up from a monthly support has the ability to push a strong push

GBP/AUDBuy: USD / JPY
Buy Limit: 1.71550
SL @ 1.70750
TP @ 1.73530
Max Risk: 2%
(When calculating, do not forget about different spreads from Brokers)
Leave comments or likes to keep our content free and alive.
Have a good week to everyone
It is not an investment recommendation

GBPAUD LONG - Watch to Buy - W1 ChartGBPAUD LONG - Buy- W! Chart
Watch for Buying
Symbol: GBPAUD
Timeframe: H4 - W1
Type: BUY
Entry Price: Watch for Buying
Resistance Becomes Support @ 1.79157 ( Important Levels )
Resistance Becomes Support @ 1.78127 ( Important Levels )
✅ If you liked this analysis, please consider Following and giving it a Thumbs Up 👍
✅ If you have any feedback or questions, please leave a comment below as I answer each comment 💬
✅ Wishing you enjoyable successful trading 🙏


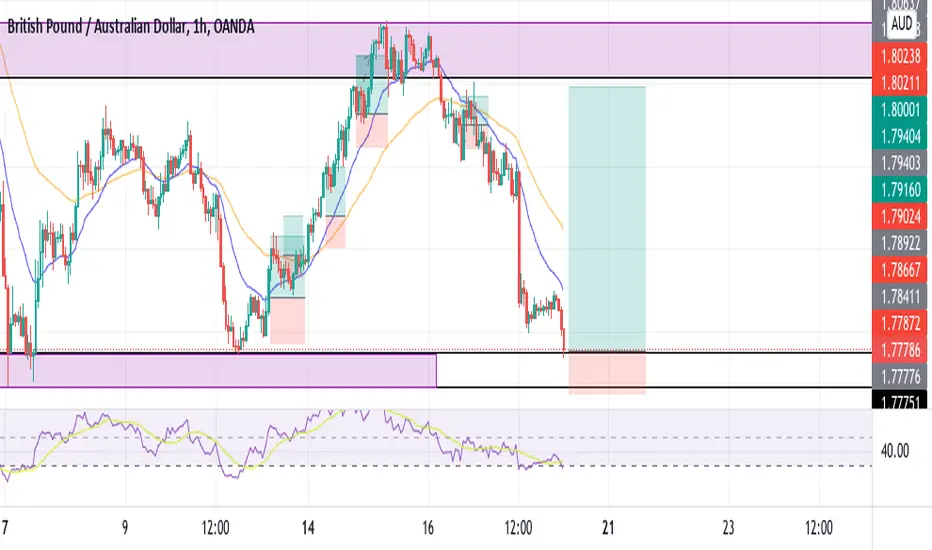
GBPAUDPrice currently in demand zone of the previous year 2021, January. We looking at the market picking up a Long around 1.74250/1.74000.
We have a lot of impact news this week.
We watch out for Break of structure(BOS) on smaller TF.

GBPAUDPrice is respecting the the previous low and the demand zone some call it support area.Bullish rally taking charge of price as the selling momentum weakens.trade safe and be blessed

GBP/AUDBUY: GBP / AUD
Buy Limit: 1.74330
SL @ 1.73770
TP @ 1.75900
Max Risk: 2%
(When calculating, do not forget about different spreads from Brokers)
Leave comments or likes to keep our content free and alive.
Have a good week to everyone
It is not an investment recommendation

GBP/AUD Symmetrical TriangleGBP/AUD has successfully tested the 1.2715 support, and the sellers are exerting a huge amount of pressure to break the support level (as shown in arrow 3). But any successful rebound toward the upside of the market.
A break above the upper trendline would initiate a new bullish wave and this could be a huge spike because we will all be buying. LOL.
I am looking forward to a long position, and my entry-level is above the upper trendline at 1.7880.

GBPAUD longThe trade will be executed on Monday so we let it run over the weekend and it forms a solid structure so we also have a solid confluence for a LONG

GBPAUD | INVERSE CUP & HANDLEGBPAUD has been in bearish pressure on daily timeframe and is holding this support zone since last year feb.
On shorter time frame, this is inverse cup and handle which is a continuation pattern. So expect more down side in this pair
Trade your levels accordingly.

GBP/AUDBuy: GBP / AUD
SL @ 1.76820
TP @ 1.79690
Max Risk: 2%
(When calculating, do not forget about different spreads from Brokers)
Leave comments or likes to keep our content free and alive.
Have a good week to everyone
It is not an investment recommendation

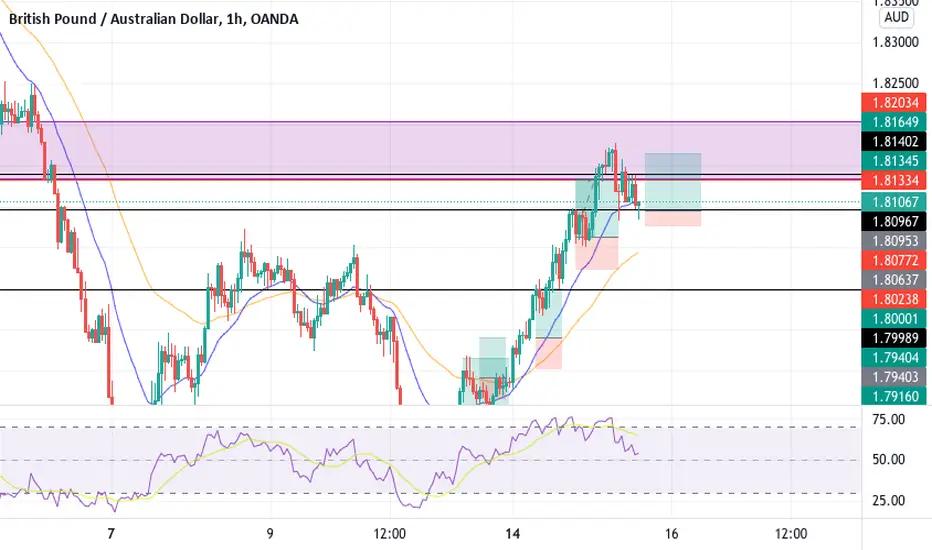
GBPAUD- Buy Long Tripple Bottom Formation based on prAfter testing the previous support 2 times before and retracing, Likely to continue up into a long buy. The entry point for a long as GBP is getting stronger.
GBPAUD LONGList of confluences:
1: Double Bottom
2: Trendline Breakout
3: Change in market structure.
Risk Reward: 14.42 to 1

GBPAUD LONG - Buy Entry - H4 ChartGBPAUD LONG - Buy Entry - H4 Chart
Buy @ Market
Symbol: GBPAUD
Timeframe: H4
Type: BUY
Entry Price: Buy @ Market
PP Y1 - TP - Resistance @ 1.8390 - Yearly Pivot Point
TP - Resistance @ 1.83149
Support @ 1.80098
Support @ 1.77497

GbpAud_Swing_H41. H4 ICT Breaker
2. M15 BOS (Break of Structure)/BMS (Break of Market Structure)
Potential TP Zones:
TP1. 1.8300
TP2. 1.9100

GBPAUD (LONG) 🔥🔥🔥This is for reentry for the continuation of the W pattern which is the double bottom formation.
Risk Disclaimer:
Please be advised that I am not telling anyone how to spend or invest their money. Take all of my analysis as my own opinion, as entertainment, and at your own risk. I assume no responsibility or liability for any errors or omissions in the content of this page, and they are for educational purposes only. Any action you take on the information in this analysis is strictly at your own risk. There is a very high degree of risk involved in trading. Past results are not indicative of future returns. Good luck

GBPAUD- BUY Continuation of LongGBPAUD has been on an uptrend and after reaching a key level has retested and reset the buying pressure. Likely to continue with the uptrend and SL risk is small.
GBP/AUD Trying To Make Double Bottom, Long Setup After ClosureThis is an educational + analytic content that will teach why and how to enter a trade
Make sure you watch the price action closely in each analysis as this is a very important part of our method
Disclaimer : this analysis can change at anytime without notice and it is only for the purpose of assisting traders to make independent investments decisions

GBPAUD H4 TradeWe are Expecting to buy GBPAUD from this H4 Demand 1.79039 to Supply 1.81882 after Confirmation, We are expecting big buy till the Weekly Zone 1.89913 Stay Connected for more updates.
