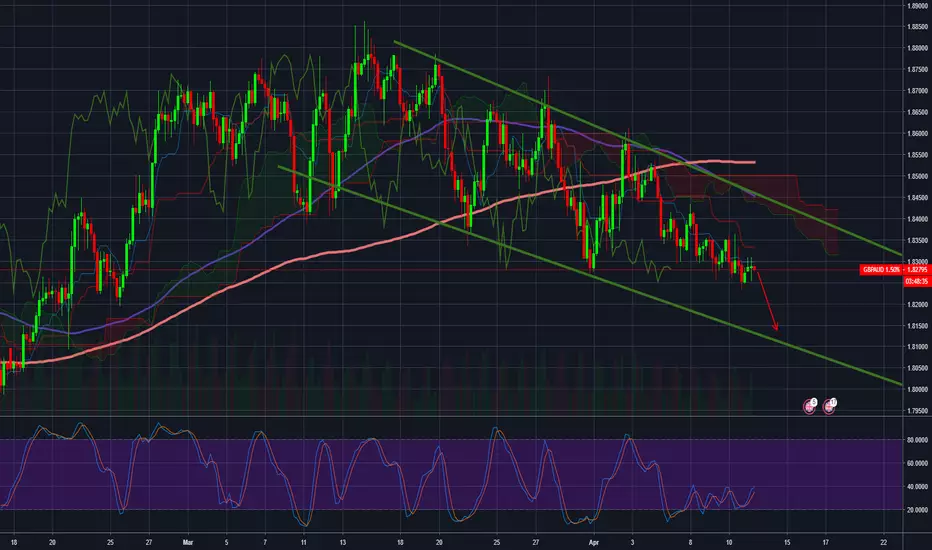
Sell on GBPAUD because sell retest buy angle mirrors patternOpen sell order on 1.8240
SL - 1.8295
TP - 1.8090
RRR - 1:2.32
RRR not big but interesting trade - sell retest buy angle mirrors pattern.
We have strong news tomorrow night, so i waiting good sell movement.
GBP is going sell too (attached idea)
Gbpaudsell

FALSE INFORMATIONHere we can see a clear trend line ( TL ) marked out that has been used as previous resistance and now turned support.
We are expecting price to keep bouncing off this TL and following it down in a bearish movement.
We are keeping this 1 short, sweet and simple as that is the best way to look at charts and learn.
Most of the information on the internet to do with trading is put up by the government just to confuse people into thinking you need to use 1000000 indicators or you will fail... This is what they want us to do FAIL so we all stay in line and continue to line the governments pockets with our hard earned cash.
Rant over... for now :p

GBP AUD - Short SELL Opportunity...Entered a small position on this one, caught a few pips, will be adding to it on the retest of the lower yellow resistance...

GBPAUD SELL ON 1HAnticipating shift in trend downwards as price action demonstrates a strong momentum swing down. Additionally, MACD + Stochastic + RSI provide additional support for my hypothesis

70-100 pips.We are expecting to see price drop into our support zone ( purple box ) there is good bearish pressure at the moment and the zone we have marked on our charts is a strong support zone.
Simple charts allow you to see setups more clearly, don't be fooled by these people who have 10000 indicators on there charts, yes that might work for them but simple really is better in forex.
This trade could give you around 70-100 pips.
Only trade if the analysis matches up with your own.

#GBPAUD H4 Signal!H4-We have here a red descending channel as can be seen in the graph above
Sell GBPAUD:
Entry Price: 1.8288
Take Profit: 1.8135
Stop Loss: 1.8350
Aussie to reign over the Pound? - Ichimoku Short Trade SetupThis setup we will have to wait to develop a bit. I am looking for a slight rise to tenken sen where I will look for a confirmation of a sell. Two ways that could manifest itself is in the form of a good rejection candle with a long wick on top that closes below tenken sen, or for price to see a hard rejection there and start heading down. So we'll have to watch this one vs waiting for a trigger order like some of the other setups I walk through. If we see that good rejection I will enter a sell targeting previous price structure on the left side of the screen. I've also drawn out some partial profit levels where I'll look to trade profit and risk off the table should I enter a sell. If we fail to get a strong rejection at tenken sen, we may also look for that rejection at kijun sen. If those both fail, this setup may become invalidated.

GBP/AUD Head and Shoulder About to Break For a Big ShortI could see a possible short for a beautiful 2.5:1. Now we just going have to wait for a reversal somewhere around this red zone.


GBPAUD Trend Change incoming...We can see here GBPAUD has made new lows, broken the long term trend line and rejecting at the resistance zone to find confluence with the 38.20% Fibonacci level giving a sell indication.
Confirmation for trend reversals:
Trend line break
Support/resistance break and retest
Fibonacci level retest 38.20% - 61.80%


BEAR with me Price is at a resistance level and we are expecting it to respect this level, now it isn't the strongest level in the world but over the weekend there has been a lot of uncertainty and negative news surrounding brexit, a big march with thousands of people protesting, MPs calling for May to step down as priminister and the growing possibility that we might leave the EU with no trade deal.
We are expecting a bearish market gap at opening tonight with a couple of days bearish movement, from where price is now to our green zone is a 200 pip move which we are expecting price to reach this week.
We are just going to have to BEAR with Brexit as we can see a lovely bearish week coming.
Please be careful if you are trading GBP pairings though, use correct risk management and a tight SL.

EMOTIONS + TRADING = FAILUREWe are looking at a lovely sell on this pairing with a possible retest of recent highs, in our last post we could see price following our TL down to our area, price did break this TL and we can now see price re testing our resistance level before making a move lower to our green zone.
Remember trade with patience, without this you will loose to the market, also trade with NO EMOTIONS as these emotions will make you think and act differently when you loose a trade of up the lot sizes.

Clear your mind of all the BULL#HITWe can see that price is respecting our trend line and has recently spiked through it, the current candle is a big bullish one and we can only see this level been respected again, so bearish movement from here... SIMPLICITY IS KEY.
Clear your mind of the bull#hit and trading is really simple.

GBPAUD - WEEKLY SWING - 12. MAR. 2019WELCOME TO DACAPITAL-TRADING!
GBPAUD FOREX BREAKDOWN 12 MAR 2019
1 HOUR
Very strong price action occurred into our resistance level
4 HOUR
Bullish market turning bearish with good short entrys now!
DAILY
Overall bullish market with no pullbacks, we need some price movement to the downside!
LEVELS
SELL GBPAUD
ENTRY @ 1.86670
SL @ 1.87920 (125 Pips)
TP @ 1.84810 (185 Pips)
RR: 1.50, use 1/3 of normal risk!
IF YOU HAVE ANY QUESTIONS LET US KNOW IN THE COMMENTS
ALSO LEAVE US A LIKE TO KEEP OUR CONTENT FOR FREE!!


Potential Sell for GBPAUDGBPAUD closed under Support,
Potential Sell from 1.8450 to 1.8200
Start - 1.8450
Stop Loss -1.8554 (if candle closes above 1h-4h Chart)
Take Profit- 1.8182

200 pip FREE TRADEWe are looking for a possible retest and bounce of key support before we jump in this trade, if we do get the bounce then we could see a possible bullish rally of around 200 pips.
But you must wait for the retest and bounce because if price does break this strong level then it could sink.... so just be patient ;p


SHORTBREAD... who doesnt love biscuits ;p Price hit resistance at the top and is now following a lovely trend line, we expect price to follow our TL down into our green zone which has previously been used as a key support and resistance area, so this is where our TP will be placed.
This trade will give us 100+ pips, but if you take this trade please remember to use correct risk management.
So go SHORT and get that BREAD ;p


GBPAUD - MAKE SURE YOU JOIN THIS SHORTits simple, this has a very good risk 2 reward ratio.
i am expecting this GBPAUD pair to drop soon. dont miss it.
See previous analysis
PLEASE SUPPORT THE MOVEMENT WITH YOUR LIKES, COMMENTS AND FOLLOW FOR MORE
