GBPAUD- SellGBPAUD at a point of resistance. Has been on a downtrend and is likely to continue with downtrend.
Gbpaudshort
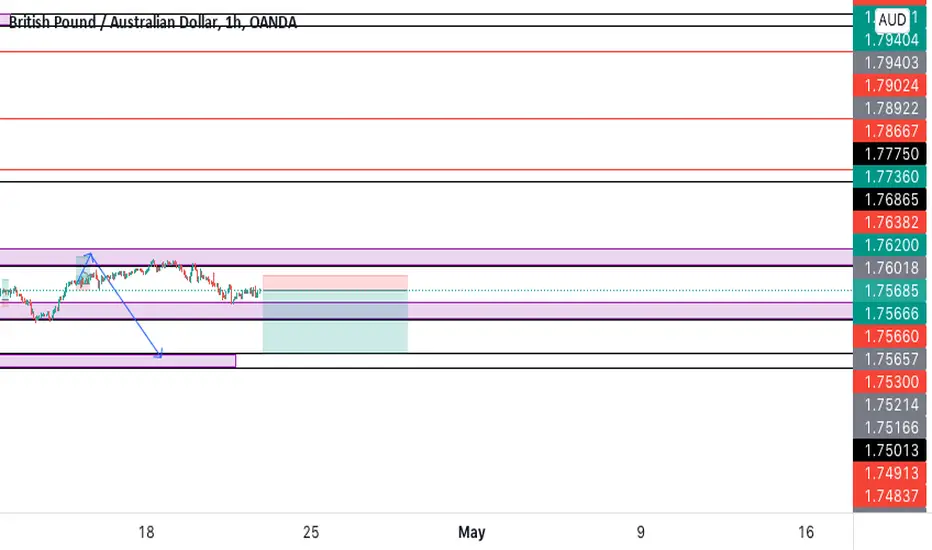
GBPAUD Chart H1Here is my view for GBPAUD on H1. The price could go down, you can put a pending order on the Order block or find an entry on LTF within OB Zone. Trade Safe!

GBP AUD Short Term
RSI Below 50 and under SMA.
It's resistance as well.
Bfore entering the trade do your own research.

GBPAUD | Follow-up detailsA follow-up detail on the GBPAUD that was published earlier this week (see link below for reference purposes) where we locked in around 70pips before price action took us out. Now we are at a very critical level (1.76) where a breakout of this zone (supply area) might incite a bullish continuation. However, considering the long-term bearish momentum on the higher timeframe, I am of the opinion that the price needs one more bearish move before buyers finally garner the strength to push the price to the upside.
Risk Disclaimer:
Margin trading in the foreign exchange market (including commodity trading, CFDs, stocks etc.) has a high risk and is not suitable for all investors. The content of this speculation (including all data) is organized and published by me for the sole purpose of education and assistance in making independent investment decisions. All information herein is for your reference only and I take no responsibility.
You are hereby advised to carefully consider your investment experience, financial situation, investment objective, risk tolerance level, and consult your independent financial adviser as to the suitability of your situation prior to making any investment.
I do not guarantee its accuracy and is not liable for any loss or damage which may result directly or indirectly from such content or the receipt of any instruction or notification therewith.
Past performance is not necessarily indicative of future results.

GBPAUD | RESISTANCE AHEADGBPAUD after giving a breakout from bearish parallel channel, moves into bullish trend which is well supported by rising support.
We have hidden divergence which means limited upside left in shorter term.
Trade your levels accordingly.

GBPAUD | perspective for the new weekDespite the obvious, that price action is currently sitting on a strong demand zone; I shall be looking for an opportunity to sell the Pound against the Aussie in the meantime if the price does not break out of the structure explained in the video.
Risk Disclaimer:
Margin trading in the foreign exchange market (including commodity trading, CFDs, stocks etc.) has a high risk and is not suitable for all investors. The content of this speculation (including all data) is organized and published by me for the sole purpose of education and assistance in making independent investment decisions. All information herein is for your reference only and I take no responsibility.
You are hereby advised to carefully consider your investment experience, financial situation, investment objective, risk tolerance level, and consult your independent financial adviser as to the suitability of your situation prior to making any investment.
I do not guarantee its accuracy and is not liable for any loss or damage which may result directly or indirectly from such content or the receipt of any instruction or notification therewith.
Past performance is not necessarily indicative of future results.

GBPAUD | BREAKOUT LOADING ..GBPAUD is about to give horzontal breakout from the level of 1.75100 where price remain for couple of hours after giving a breakout from falling bearish trendline.
Alternatively breaking below this range can call bears in the power.
Trade your levels accordingly.

GBP/AUD Long IdeaHello Traders
Last few weeks were so harsh for GBP/AUD as this pair had a non-stop falling.
Now its seems GBP found some space to breath.
We believe Price will see some Correction.
Also:
1- We can see Dragonfly Doji Candle in Weekly TF.
2- Downward Trendline has been broken.
3- We can see RD+ in RSI.
4- RSI has broken its downward trendline.
Thanks For Reading
Team Fortuna
-RC

GBP/AUDSell: GBP / AUD
SL @ 1.75385
TP @ 1.73150
Max Risk: 2%
(When calculating, do not forget about different spreads from Brokers)
Leave comments or likes to keep our content free and alive.
Have a good week to everyone
It is not an investment recommendation

GBPAUD | BREAKOUTGBPAUD after completing our cup and handle target (watch last update), has bounced from parallel channel support and manages to break above the channel. We are bullish as long as it is trading above the breakout level.
Trade your levels accordingly.

Australian currency correctionFX:GBPAUD
The correction that occurred in the Australian currency was caused by a decrease in the trade balance in that country, causing corrections in several Australian currency pairs such as, AUD/USD, GBP/AUD, EUR/AUD and so on.
Bearish potential still exists in the pair GBP/AUD

GBP/AUDSell: GBP / AUD
Sell limit: 1.73850
SL @ 1.74660
TP @ 1.72400
Max Risk: 2%
(When calculating, do not forget about different spreads from Brokers)
Leave comments or likes to keep our content free and alive.
Have a good week to everyone
It is not an investment recommendation

GBPAUD Prediction H1Here is my view for GBPAUD on H1. The price should go down, you can put a pending order on the Order block or find an entry on LTF within OB Zone. Trade Safe!

GBP/AUDSell: GBP / AUD
SL @ 1.73680
TP @ 1.75220
Max Risk: 2%
(When calculating, do not forget about different spreads from Brokers)
Leave comments or likes to keep our content free and alive.
Have a good week to everyone
It is not an investment recommendation

GBPAUD Prediction H1Here is my view for GBPAUD on H1. The price should go down, you can put a pending order on the Order block or find an entry on LTF within OB Zone. Trade Safe!

GBPAUD shortHey traders, in the coming week we are monitoring GBPAUD for a selling opportunity around 1.754 zone, once we will receive any bearish confirmation the trade will be executed.
Trade safe, Joe.

GBPAUD ShortHey traders, in today's trading session we are monitoring GBPAUD for a selling opportunity around 1.757 zone, once we will receive any bearish confirmation the trade will be executed.
Trade safe, Joe.

GBPAUD WeaklyHello friends | I only do simple analyzes with this phone If a small screen is displayed to you I'm sorry Well as shown in the analysis GBPAUD at 12% weekly timeframe Has almost fallen A 12% drop pattern is expected to continue to form in the weekly timeframe But according to the price pivot 1.7568 Have a pullback up and then the price will fall again 🔻 Thank you very much for your support 🌹 Only the analysis is personal and do not see the signal 🚫 Please support us in this direction to provide more analysis 🙌🌹❤

GBPAUD IS SHORTMy views on GBPAUD is bearish heading towards the support line of 1.75120 to retest it or break it.

GBPAUD Prediction H1Good morning, here is my view for GBPAUD on H1. The price should go down, you can put a pending order on the Order block or find an entry on LTF within OB Zone. Trade Safe!

GBPAUD Chart H1Here is my view for GBPAUD on H1. The price should go down, you can put a pending order on the Order block or find an entry on LTF within OB Zone. Trade Safe!

shortAs we can see on the 30-minute chart there is an order block that needs to be mitigated, that's where we expect to enter our short trade, but also on HTF it's clear is a bear market.

GBPAUD Prediction H4Here is my view for GBPAUD on H4. The price should go down, you can put a pending order on the Order block or find an entry on LTF within OB Zone. Trade Safe!
