GBPAUD Market Outlook | Daily Forex Market BreakdownGBPAUD
Breaking down GA as it was requested from one of our forex alchemists! You ask and I will deliver!
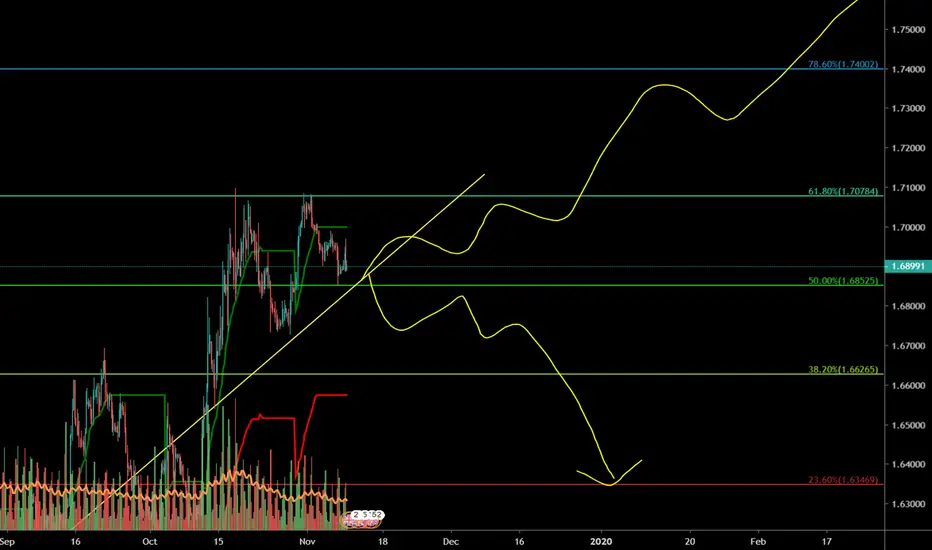
As you can see in the technical analysis above GA has been a bit tricky. We experienced multiple fake outs to the downside which is expected. This is why you don't just jump into a trade when all you see is a simple break of a trend line. I always say there is a lot of confusion in the market around trend lines so always be cautious.
After the fake outs to the downside GA pushed up quite a bit then showed us a beautiful double top. This is where more experienced traders would have taken shorts. I personally wanted to see price push up a third time giving us a clean entry! Remember there is always another entry or a better trade right around the corner, never rush things! Only gamblers force trades, we are focusing on becoming the best forex traders possible to make this a reality you need to develop ridiculous amounts of patience.
Patience, risk management, and always sticking to your trading plan is the key to longevity in this market.
IT IS NOT EASY, BUT IT IS DEFINITELY WORTH IT!
Gbpaudsignal

GBPAUD buy on H1Plan : trendline breakout --> wait for prices to bounce off trendline support --> wait for the rejection candle pattern to form e.g. bullish engulfing , pinbar etc --> BUY
**Disclaimer** the content on this analysis is subject to change at any time without notice, and is provided for the sole purpose of assisting traders to make independent investment decisions.
Traders!! if you like my ideas and do take the same trade like i do, please write it in comment so we can manage the trade together.
_____________________________________________________________________________________________________________________
Thank you for your support ;)
GWBFX


GBPAUD 30MHello traders,
we have a short here for a pip count of +94/-94.
Entry short at the red price and target at the green
down below.


GBPAUD Market Outlook | Daily Forex Market BreakdownGBPAUD
Pushing to the downside a bit right now. That being said for the time being support looks to be holding. I have a similar bias to GU I believe that we were going to push back up and fail to make a new high and then we are going to roll over to the downside. Keeping a very VERY close watch on all GU pairs.

GBPAUD Analysis: Price much likely to go downHi traders,
GBPAUD has been on the rise and following an ascending channel which it has respected faithfully for a long time since November 2017.
It has now come to its top/resistance line. It is also at a strong horizontal resistance zone.
There is a high chance that price may bounce off towards the support line of the structure.
I would suggest you sell only when the price manage to break the support line of the minor channel that is within the major channel.
Share your views about this pair in the comment section. If you agree with the idea to show agreement.

GBPAUD Sell on H3, rising wedge patterns have formedNote : wait for prices to bounce off the trendline resistance --> wait for the rejection candle to form e.g. bearish engulfing, pinbar etc --> SELL
**Disclaimer** the content on this analysis is subject to change at any time without notice, and is provided for the sole purpose of assisting traders to make independent investment decisions.
Traders!! if you like my ideas and do take the same trade like i do, please write it in comment so we can manage the trade together.
_____________________________________________________________________________________________________________________
Thank you for your support ;)
GWBFX

GBPAUD Market Outlook | Daily Forex Market BreakdownGBPAUD
The same thing I just explained in GJ there’s always going to be multiple chances for entries. You need to learn to not rush into the market. Even though GA is pushing lower for the time being to me it is looking bullish overall I feel we can go higher. I will be standing on the sidelines for now.

GBPAUD Market Outlook | Daily Forex Market BreakdownGBPAUD
This Pair has been playing out flawlessly. We have been calling everything perfectly, the market has just been lacking the volume needed. GA definitely pushed up to where we would want to take shorts, but as we say time and time again there is always another opportunity right around the corner and its not wise to get into a habit of jumping at every opportunity for an entry you see. Sit back trust your technical analysis, plan your trade and TRADE YOUR PLAN.

GBPAUDGoing Short..Remember trading ideas in most cases tend to play out..use proper risk management..Trade smart and be Blessed

GBPAUD 30M Using Support and Resistance to plan targets.Hello Traders,
This provides some description on how to use S/R zones for targets,
along with the current trade I'm in now.
Best,
Jay


GBPAUD - Sell and sell limit on H4GBPAUD sell at the current price 1.9001, sell limit 1.9050, stoploss 1.91
-----Nukida

GBPAUD SellGbpaud Fale Break H1 trend line
Inside bar h4
H4 M pattern
D1 Double top
**Disclaimer**
the content on this analysis is subject to change at any time without notice, and is provided for the sole purpose of assisting traders to make independent investment decisions.
_________________________________________________________________________________________________________________________________________
Thank you for your support!
Tradewithsam

GBPAUD Set Up for a Massive DeclineGBPAUD is making a series of (i)-(ii), i - ii, wave pattern which usually leads to subsequent decline.
On the higher timeframe, price is sitting at a key resistance level that lined up with 50% Fibonacci retracement of the weekly decline.
Price has the potential to sell-off from or near the current level and should not breach at least the major invalidation level indicated on the chart to remain valid.
What's your thought about GBPAUD? Kindly let me know in the comment.
Thanks for reading!
Veejahbee.

GBPAUD 60MHello Traders!
This pair has ascending value for
a 25 pip move up. Stop should still
be set at 1:1. 1st target 25 pips and
2nd set at 50 pips.
Best,
Jay

GBPAUD looking Bullish!!Price currently shows a price drop for 1.85 level as for long term at least 600 pips expected from there!!

GBPCAD at an important level !!GBPCAD pair is at the 50 Fibonacci levels which can either turn out bullish or bearish. Next week it will give us confirmation about the tren change!
GBPAUD 15MHello traders!
This is a Tag&Go setup long, a buy stop order,
set and forget style is right on the red line at
1.90301 (at this moment a market buy order)
The red circle is the stop and 1st and 2nd
targets are in green up high.
Best,
Jay


GBPAUD possible BuySimple and clean set up where price after a long daily correction wich formed a clear bullish wedge that retested the previosu weekyl/daily structure and yesterday we coudl see how price boosted by fundamental finally clsoe abvoe this wedge forming a 4h structure and impulse indicating a possible uptrend continuation
Detaield signal n oru Telegram Channel : t.me
