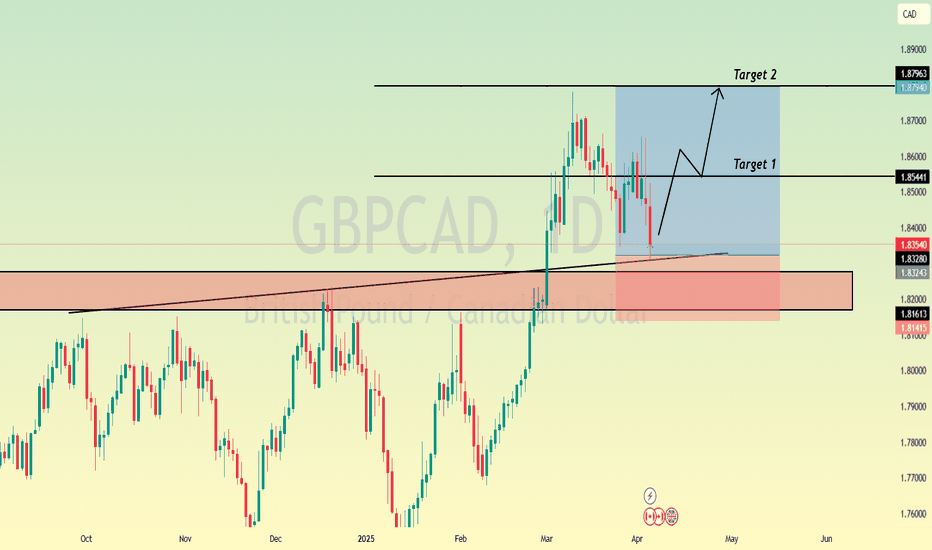
Bullish bounce?GBP/CAD is reacting off the support level which is an overlap that is slightly above the 61.8% Fibonacci retracement and could potentially rise from this level to our take profit.
Entry: 1.8139
Why we like it:
There is an overlap support level that is slightly above the 61.8% Fibonacci retracement.
Stop loss: 1.8000
Why we like it:
There is a pullback support level that lines up with the 71% Fibonacci retracement.
Take profit: 1.8385
Why we like it:
There is a pullback resistance level that aligns with the 50% Fibonacci retracement.
Enjoying your TradingView experience? Review us!
Please be advised that the information presented on TradingView is provided to Vantage (‘Vantage Global Limited’, ‘we’) by a third-party provider (‘Everest Fortune Group’). Please be reminded that you are solely responsible for the trading decisions on your account. There is a very high degree of risk involved in trading. Any information and/or content is intended entirely for research, educational and informational purposes only and does not constitute investment or consultation advice or investment strategy. The information is not tailored to the investment needs of any specific person and therefore does not involve a consideration of any of the investment objectives, financial situation or needs of any viewer that may receive it. Kindly also note that past performance is not a reliable indicator of future results. Actual results may differ materially from those anticipated in forward-looking or past performance statements. We assume no liability as to the accuracy or completeness of any of the information and/or content provided herein and the Company cannot be held responsible for any omission, mistake nor for any loss or damage including without limitation to any loss of profit which may arise from reliance on any information supplied by Everest Fortune Group.
GBPCAD
Potential bearish drop?GBP/CAD is reacting off the pivot which is an overlap resistance and could drop to the 1st support.
Pivot: 1.8157
1st Support: 1.7918
1st Resistance: 1.8332
Risk Warning:
Trading Forex and CFDs carries a high level of risk to your capital and you should only trade with money you can afford to lose. Trading Forex and CFDs may not be suitable for all investors, so please ensure that you fully understand the risks involved and seek independent advice if necessary.
Disclaimer:
The above opinions given constitute general market commentary, and do not constitute the opinion or advice of IC Markets or any form of personal or investment advice.
Any opinions, news, research, analyses, prices, other information, or links to third-party sites contained on this website are provided on an "as-is" basis, are intended only to be informative, is not an advice nor a recommendation, nor research, or a record of our trading prices, or an offer of, or solicitation for a transaction in any financial instrument and thus should not be treated as such. The information provided does not involve any specific investment objectives, financial situation and needs of any specific person who may receive it. Please be aware, that past performance is not a reliable indicator of future performance and/or results. Past Performance or Forward-looking scenarios based upon the reasonable beliefs of the third-party provider are not a guarantee of future performance. Actual results may differ materially from those anticipated in forward-looking or past performance statements. IC Markets makes no representation or warranty and assumes no liability as to the accuracy or completeness of the information provided, nor any loss arising from any investment based on a recommendation, forecast or any information supplied by any third-party.
GBPCAD: Bullish Continuation is Expected! Here is Why:
Remember that we can not, and should not impose our will on the market but rather listen to its whims and make profit by following it. And thus shall be done today on the GBPCAD pair which is likely to be pushed up by the bulls so we will buy!
Disclosure: I am part of Trade Nation's Influencer program and receive a monthly fee for using their TradingView charts in my analysis.
❤️ Please, support our work with like & comment! ❤️
GBPCAD will Fly , All Confirmations are in the Bullish SideHello Traders
In This Chart GBPCAD HOURLY Forex Forecast By FOREX PLANET
today GBPCAD analysis 👆
🟢This Chart includes_ (GBPCAD market update)
🟢What is The Next Opportunity on GBPCAD Market
🟢how to Enter to the Valid Entry With Assurance Profit
This CHART is For Trader's that Want to Improve Their Technical Analysis Skills and Their Trading By Understanding How To Analyze The Market Using Multiple Timeframes and Understanding The Bigger Picture on the Chart
GBPCAD Set To Grow! BUY!
My dear friends,
Please, find my technical outlook for GBPCAD below:
The instrument tests an important psychological level 1.8357
Bias - Bullish
Technical Indicators: Supper Trend gives a precise Bullish signal, while Pivot Point HL predicts price changes and potential reversals in the market.
Target - 1.8460
About Used Indicators:
Super-trend indicator is more useful in trending markets where there are clear uptrends and downtrends in price.
Disclosure: I am part of Trade Nation's Influencer program and receive a monthly fee for using their TradingView charts in my analysis.
———————————
WISH YOU ALL LUCK
GBP/CAD SENDS CLEAR BEARISH SIGNALS|SHORT
Hello, Friends!
We are targeting the 1.851 level area with our short trade on GBP/CAD which is based on the fact that the pair is overbought on the BB band scale and is also approaching a resistance line above thus going us a good entry option.
Disclosure: I am part of Trade Nation's Influencer program and receive a monthly fee for using their TradingView charts in my analysis.
✅LIKE AND COMMENT MY IDEAS✅
GBPCAD: Will Start Growing! Here is Why:
The recent price action on the GBPCAD pair was keeping me on the fence, however, my bias is slowly but surely changing into the bullish one and I think we will see the price go up.
Disclosure: I am part of Trade Nation's Influencer program and receive a monthly fee for using their TradingView charts in my analysis.
❤️ Please, support our work with like & comment! ❤️
GBPCAD - Is Bullish Breakout Ahead?TF: 4h
GBPCAD is initiating along opportunity by completing 4th intermediate wave at 1.83464 . We can expect a retracement then reversal with near the lower trendline of the parallel channel.
Once price comes down, we will have the opportunity to go long with minimum stop level at low of the wave 4 at 1.83640 . The bullish scenario is capable GBPCAD to provide 1.8654 - 1.8748 targets to the buyers.
If the breakdown occurs, wave (4) will go deep. We update this chart time to time. Traders should only buy after a clear reversal.
Gbpcad SellPrice has been making LL pointing to strength in downtrend and now price closed below the oh so very important 1.85172. the stop i wouldve like to put it above the last high but its ok im still is comfortable with it due to the volume nice scalp based on how fast the trade should hit tp or sl.
GBPCAD My Opinion! BUY!
My dear friends,
Please, find my technical outlook for GBPCAD below:
The price is coiling around a solid key level - 1.8475
Bias - Bullish
Technical Indicators: Pivot Points High anticipates a potential price reversal.
Super trend shows a clear buy, giving a perfect indicators' convergence.
Goal - 1.8526
About Used Indicators:
The pivot point itself is simply the average of the high, low and closing prices from the previous trading day.
Disclosure: I am part of Trade Nation's Influencer program and receive a monthly fee for using their TradingView charts in my analysis.
———————————
WISH YOU ALL LUCK
GBPCAD INTRADAY Breakout retest The GBP/CAD currency pair maintains a bullish sentiment, supported by the prevailing uptrend. Recent intraday price action shows a corrective pullback toward the previous consolidation zone and the support trendline area.
Bullish Scenario:
The key trading level to monitor is 1.8400, which represents the previous consolidation range. A successful bullish bounce from this level could trigger an upside move toward the 1.8640 resistance. Sustained bullish momentum could then target the next resistance levels at 1.8730 and 1.8800 over the longer timeframe.
Bearish Scenario:
Conversely, a decisive break below 1.8400, with a daily close below this level, would invalidate the bullish outlook. This could open the way for a deeper retracement toward 1.8310, with further downside potential targeting 1.8200.
Conclusion:
The overall sentiment remains bullish as long as 1.8400 holds as support. Traders should look for bullish confirmation at this level to sustain upward momentum. A break below 1.8400 would indicate a potential trend reversal, signaling further downside risk.
This communication is for informational purposes only and should not be viewed as any form of recommendation as to a particular course of action or as investment advice. It is not intended as an offer or solicitation for the purchase or sale of any financial instrument or as an official confirmation of any transaction. Opinions, estimates and assumptions expressed herein are made as of the date of this communication and are subject to change without notice. This communication has been prepared based upon information, including market prices, data and other information, believed to be reliable; however, Trade Nation does not warrant its completeness or accuracy. All market prices and market data contained in or attached to this communication are indicative and subject to change without notice.
GBP/CAD 4H ANALYSIS – BULLISH BREAKOUT OR REVERSAL ?📉 Descending Channel
🔴 The price was moving inside a downward trend (channel) 📉, but it broke out ✅, signaling a potential bullish move 📈.
📍 Demand Zone (Support) at 1.85000 - 1.84201
🟦 Buyers stepped in here, pushing the price up 🚀.
🛑 Stop Loss: 1.84201 🔻 (If price falls below this, the bullish setup may fail ❌).
📍 Resistance Area Around 1.86000 - 1.86500
🔵 Key level to watch! If the price breaks above this zone, expect more upside 📈.
🎯 Target Point: 1.87727
🎯 If buyers remain strong, price could hit this level next! 🎯🚀
📊 Indicator Check:
📍 9-period DEMA (1.85000) 🟡 – Price is above this moving average, favoring a bullish bias ✅.
🔥 Possible Trade Setup:
✅ Buy Entry near 1.85000 - 1.85500
🎯 Target: 1.87727 📈
🛑 Stop Loss: 1.84201 🚨
If price breaks below 1.85000, be cautious ⚠️! A reversal to the downside could happen.
🚀 Overall Bias: Bullish (📈) above 1.85000, Bearish (📉) below **1
GBPCAD Set To Fall! SELL!
My dear subscribers,
My technical analysis for GBPCAD is below:
The price is coiling around a solid key level - 1.8578
Bias - Bearish
Technical Indicators: Pivot Points High anticipates a potential price reversal.
Super trend shows a clear sell, giving a perfect indicators' convergence.
Goal - 1.8493
About Used Indicators:
By the very nature of the supertrend indicator, it offers firm support and resistance levels for traders to enter and exit trades. Additionally, it also provides signals for setting stop losses
Disclosure: I am part of Trade Nation's Influencer program and receive a monthly fee for using their TradingView charts in my analysis.
———————————
WISH YOU ALL LUCK
GBPCAD - Weekly Forecast,Technical Analysis & Trading IdeasTechnical analysis is on the chart!
No description needed!
OANDA:GBPCAD
__________________________________________________________________
❤️ If you find this helpful and want more FREE forecasts in TradingView,
. . . . . . . . Hit the 'BOOST' button 👍
. . . . . . . . . . . Drop some feedback in the comments below! (e.g., What did you find most useful? How can we improve?)
🙏 Your support is appreciated!
Now, it's your turn!
Be sure to leave a comment; let us know how you see this opportunity and forecast.
Have a successful week,
ForecastCity Support Team
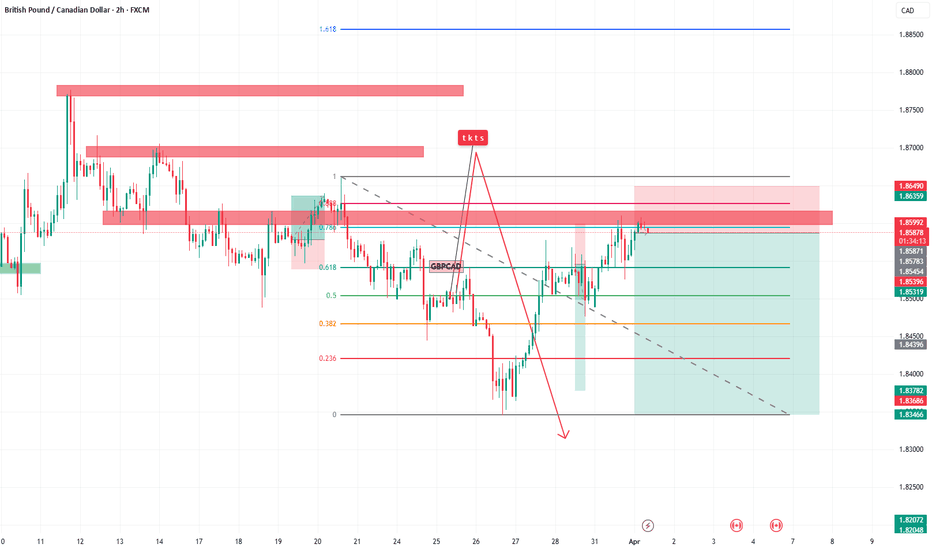
Bearish drop?GBP/CAD is reacting off the resistance level which is a pullback resistance that lines up with the 50% Fibonacci retracement and could drop from this level to our take profit.
Entry: 1.8582
Why we like it:
There is a pullback resistance level that lines up with the 50% Fibonacci retracement.
Stop loss: 1.8736
Why we like it:
There is a pullback resistance level.
Take profit: 1.8397
Why we like it:
There is a pullback support level.
Enjoying your TradingView experience? Review us!
Please be advised that the information presented on TradingView is provided to Vantage (‘Vantage Global Limited’, ‘we’) by a third-party provider (‘Everest Fortune Group’). Please be reminded that you are solely responsible for the trading decisions on your account. There is a very high degree of risk involved in trading. Any information and/or content is intended entirely for research, educational and informational purposes only and does not constitute investment or consultation advice or investment strategy. The information is not tailored to the investment needs of any specific person and therefore does not involve a consideration of any of the investment objectives, financial situation or needs of any viewer that may receive it. Kindly also note that past performance is not a reliable indicator of future results. Actual results may differ materially from those anticipated in forward-looking or past performance statements. We assume no liability as to the accuracy or completeness of any of the information and/or content provided herein and the Company cannot be held responsible for any omission, mistake nor for any loss or damage including without limitation to any loss of profit which may arise from reliance on any information supplied by Everest Fortune Group.
GBPCAD INTRADAY oversold bounce back supported at 1.8400The GBP/CAD currency pair maintains a bullish sentiment, supported by the prevailing uptrend. Recent intraday price action shows a corrective pullback toward the previous consolidation zone and the support trendline area.
Bullish Scenario:
The key trading level to monitor is 1.8400, which represents the previous consolidation range. A successful bullish bounce from this level could trigger an upside move toward the 1.8640 resistance. Sustained bullish momentum could then target the next resistance levels at 1.8730 and 1.8800 over the longer timeframe.
Bearish Scenario:
Conversely, a decisive break below 1.8400, with a daily close below this level, would invalidate the bullish outlook. This could open the way for a deeper retracement toward 1.8310, with further downside potential targeting 1.8200.
Conclusion:
The overall sentiment remains bullish as long as 1.8400 holds as support. Traders should look for bullish confirmation at this level to sustain upward momentum. A break below 1.8400 would indicate a potential trend reversal, signaling further downside risk.
This communication is for informational purposes only and should not be viewed as any form of recommendation as to a particular course of action or as investment advice. It is not intended as an offer or solicitation for the purchase or sale of any financial instrument or as an official confirmation of any transaction. Opinions, estimates and assumptions expressed herein are made as of the date of this communication and are subject to change without notice. This communication has been prepared based upon information, including market prices, data and other information, believed to be reliable; however, Trade Nation does not warrant its completeness or accuracy. All market prices and market data contained in or attached to this communication are indicative and subject to change without notice.
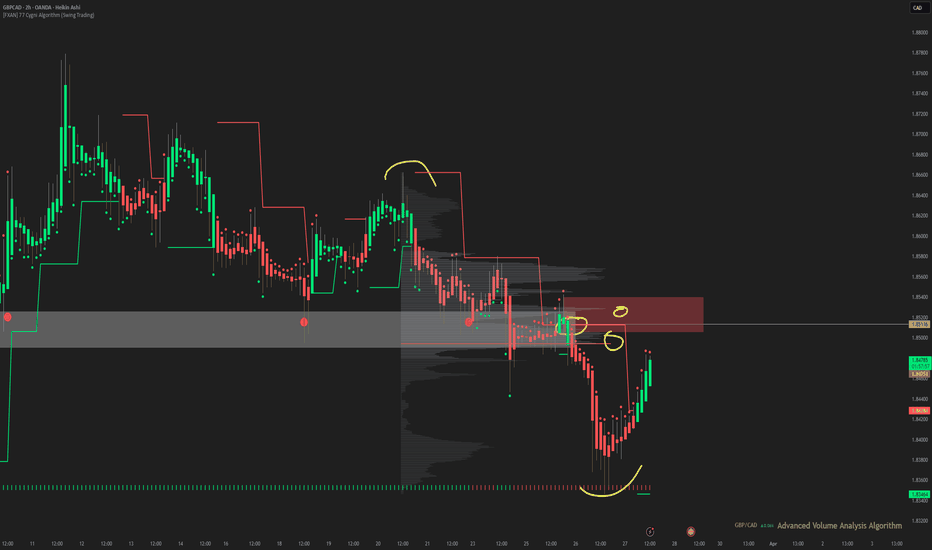
FXAN & Heikin Ashi Trade IdeaOANDA:GBPCAD
In this video, I’ll be sharing my analysis of GBPCAD, using FXAN's proprietary algo indicators with my unique Heikin Ashi strategy. I’ll walk you through the reasoning behind my trade setup and highlight key areas where I’m anticipating potential opportunities.
I’m always happy to receive any feedback.
Like, share and comment! ❤️
Thank you for watching my videos! 🙏


