Gbpcadanalysis

GBPCAD W4 NOV 2020GBPCAD
Short Setup
Broke out of trendline and fib retracement/retest done. Potential target as marked at 2 zones

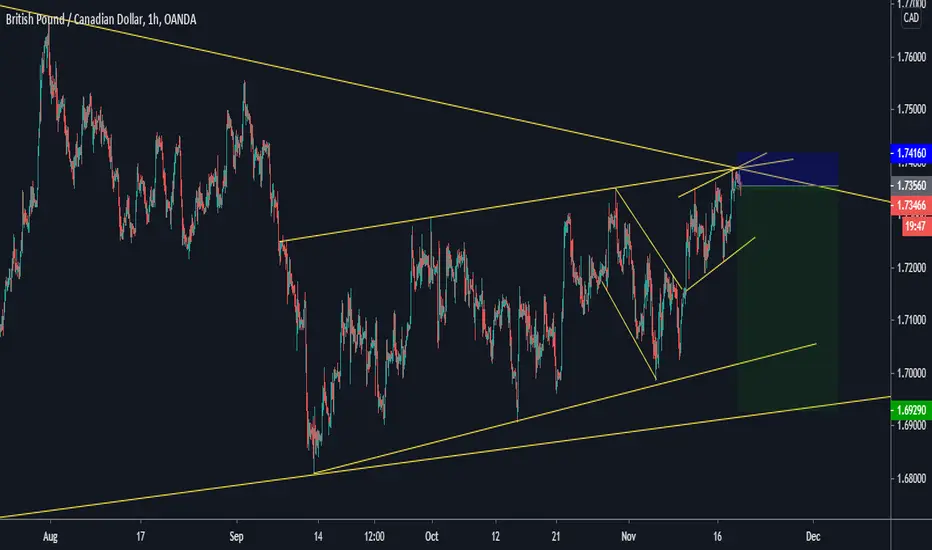
GBPCAD - Short sell opportunity ready NOWGBPCAD now is at the top of H4 pennant structure. Whats interesting here, is it reach this area with structural approach while forming multi TF ascending channel structure. Its usually signaling for a turn to the downside from this area targeting up to the bottom of the pennant structure.
I’ve already set my sell entry with sl above the pennant structure trendline. Lets see how this pair will play out..

GBPCAD Bearish OutlookThis pair has been inside a ranging channel just like the CADJPY pair. Obviously, if CADJPY shows a bullish setup this pair should show a bearish setup because they are negatively correlated pairs. The bear flag pattern of this pair is looking to end at the 78.6% Fibonacci retracement level and make another bearish run.


GBPCAD 4HRSbelow is my idea on Gpcad. keep an eye for price action confirmation around our resistance trendline afterwards go short

GBPCADWelcome back guys
Here is the full analysis for this pair, let me know in the comment section below if you have any questions, the entry will be taken only if all rules of the strategies will be satisfied. I suggest you keep this pair on your watchlist and see if the rules of your strategy are satisfied.
GBPCAD in a trend channel path, I think there will be chance for a sell entry because its touched the resistant line in the up trend
STOP LOSS 1.74500
ENTRY POINT 1.73000
TAKE PROFIT1 1.72500
TAKE PROFIT2 1.71500
TAKE PROFIT3 1.71000
Remember this analysis is not 100% accurate No single analysis is To make a decision follow your own thoughts.
The information given is not Financial Advice.
Please support this idea with a LIKE if you find it useful
Wish you luck guys

GBPCAD Selltouch athe long term downtrend and the static resistance zone and we can see a small divergence in macd.
let's see what happens....

GBPCAD SELL OPPOTUNITYAs we see, there can be another decrease for GBPCAD in 4h timeframe, as it has touched the top of two channels as the same time, shown in the idea, if it breaks up that point there would be a pullback and huge increase tho.


GBP/CAD Technical Analysis
The counter is currently in an ascending formation.
It has hit the upper parallel which also coincides with a rejection zone.
Hence, we expect the pair to retreat to lower levels from here.


Gbpcad - Analysis4 hour trend and structure is bullish, we will be waiting for the price to retrace and the we will look for confirmations to enter.

GBPCAD W1 NOV 2020GBPCAD
Long Setup
We are seeing price ranging in between this ascending channel. We can go long once price breaks this minor descending trendline. If a break downwards of this channel
occurs, a short position would be considered more profitable.

📢GBP/CAD Short Going short on this pair. Simple break and retest with momentum. Let's see how it goes 👍

GBPCAD - BUY - 4H SupportGBPCAD - BUY - 4H Support
Buy @ Current Market or a Break of 1.70959
Stop Loss @ 1.70162
Take Profit @ 1.73361
------------------------------------------------------------------------------------
🔺 Disclaimer! The content of this analysis is subject to change at any time without notice.
🔺 It is provided for the sole purpose of assisting traders to make independent investment decisions.
🔺 You must do your own research to create your own trading plan for the market.
------------------------------------------------------------------------------------

GBPCAD Top-Down AnalysisHello Traders,
Here is the Top-Down Analysis of GBPCAD (Monthly, Weekly, Daily for direction and 4H for entry) for
Week 45 - Nov 02
M > Market is moving in a well respected horizontal structure (of course with minor breakouts). Price moved up to test structural resistance and dropped till monthly support to face rejection again. While dropping each month bottom wick was getting filled by next monthly candle however this could mot happen last month.
W > On its way down price created an M formation and as expected it moved up to test the neck before continuing with bearish move. Price dropped till 0.768 Fib level on last bullish impulse before reversing to the upside.
D > Price is moving in a triangle respelling trend-lines as resistance and support, price reversed to the downside from daily supply zone. Switching to line chart we can see a W formation and can expect price to drop till its neck.
As per COT GBP saw closure of both Long and Short, in effect reducing net positions. Even Commercials have closed both Long and Short reducing open interest to least in current year. BXY ended said week in a Doji after strong buying pressure during start of the week but it weakened last week. BXY is currently moving in a rising channel, price surged 2 weeks ago hit resistance and dropped near support of channel last week. We can expect slight upward move this week. CAD has not seen much movement for Long in last 2 weeks but it reported closure of Short positions. In fact N-R have more open Long positions than Institutions. CXY improved its position for the said week however it saw huge dump last week with price showing some sign of recovery end of the week. We can expect further recovery this week.
4H > Price is finding support of upward trend-line, it is currently moving to the upside but we can see rejection wick from resistance level. We expect price to reverse to the downside with a pause at support trend-line.
Recommendation > Market is ideal for swing as well as intraday trading with each daily candle moving about 100 pips.
Pair Correlation: GBPCAD has positive correlation with GBPCHF, GBPUSD, GBPJPY and GBPNZD and negative correlation with EURGBP.
Thank You
AP17FX

GBPCAD Resistance Flipped to Supportafter breaking falling wedge price is above resistance
price successfully close above the resistance and flipped the resistance to support
use small position risk is high

GBP/CAD Short UpdateEarlier today i posted an idea on GBP/CAD sell, i just want to say congratulations to those who followed this trade. If you're still holding i would recomment taking out half the trade and move stop loss to zero as a money management technic.
CAUTION: I'm not a financial advisor or a licensed trader, this is just me making money and helping others in the process.
Yours: Crispen Mutarango
With Pip Love
