GBPCAD Long Opportunity - JANAURY RECAP (BE)Left money on the table - price rejected BE zone and SL triggered at BE.
Gbpcadlong

GBPCAD Idea H1Here is my view for GBPCAD on H1. The price could go bullish, you can put a pending order on the Order block or find an entry on LTF within OB Zone. Trade Safe!

GBPCAD LONGThis is GBPCAD and I expect it to go bullish, why?
1. The support zone at 1.64300 is a four hour support zone
2. I need price to come back to this support zone which supported price as of yesterday to come for a second leg buys.
This is one of the three pairs I've decided to be on till the rest of the year for psychological reasons, and I will try my best to drop daily update about these pairs.

GBPCAD top-down analysis Hello traders, this is a complete multiple timeframe analysis of this pair. We see could find significant trading opportunities as per analysis upon price action confirmation we may take this trade. Smash the like button if you find value in this analysis and drop a comment if you have any questions or let me know which pair to cover in my next analysis.


GBPCAD Breakout Long! GBP-CAD is trading in a local uptrend
And the pair made a rebound from
The horizontal support, then
Broke the falling resistance
So I am bullish biased
And I think that we will see
A retest of the target above

GBPCAD Falling Wedge BreakoutWe can see a breakout of a falling wedge on the daily chart which could signal the end of a pull back.
We can see price is in up trend when we look left. With this being said we will only be looking
for buying opportunities in the direction of the bigger picture trend.

LONG ON GBP/CADPrice has created the perfect break and retest to the upside on this pair.
Here is the play I will be taking.
ENTRY - 1.64550
STOP LOSS - 1.63840
TAKE PROFIT - 1.66302

Going along on GBPCAD !We see price hitting support area 1.62992 so I’ve taken a Long position with take profit at 1.67744 resistance area!
Let me know what y’all think!
Thank you!

My Outlook on GBPCAD Post Powell's speechFrom a technical analysis perspective, the GBPCAD pair has been on an uptrend since September 2022, achieving a high of 1.68449 on 14th December 2022, after the high of February 2022. Since then, the pair has seen a retracement of more than 600 pips, leaving traders uncertain as to whether the corrective move has concluded.
In the short term, the H1 time frame show that the pair is still in a downward trend, but could soon break out of the 200EMA dynamic resistance. My indicators are pointing to a rally up to 1.63430 following Powell's speech, with further gains possible if the pound continues to strengthen.
The medium and long term outlook for the pair will be determined by how the British pound performs against the Canadian dollar. If the pound remains strong, the pair could break above the dynamic resistance, while a weakening pound could push the pair lower. My short term target is 1.63430, with medium and long term targets of 1.64327 - 1.64027 and 1.68482 - 1.68328 respectively. If price fails to break the M15 dynamic resistance, we could expect price to drop to the demand zone of 1.62142 - 1.62324.

GBP/CAD long term analysisAs long as GBP/CAD parity stays above 1.6100, I think it can see 1.6660 and then 1.7360 levels.

GBP/CAD LongGBP/CAD Long.
Into some support on higher timeframe.
Target is a moving average so will be adjusted over time.
1:1 RR

GBPCAD - Long active ✅Hello traders!
‼️ This is my analysis of GBPCAD .
Here we are bullish from daily perspective, so I am looking for longs. I expect bullish price action from here as price filled the imbalance and rejected from bullish orderblock + institutional big figure 1.62000.
Like, comment and subscribe to be in touch with my content!

GBPCAD - Long from bullish orderblock ✅Hello traders!
‼️ This is my analysis of GBPCAD .
Here we are bullish from daily perspective, so I am looking for longs. I expect price to continue the retracement to fill the imbalance lower and then to reject from bullish orderblock.
Like, comment and subscribe to be in touch with my content!

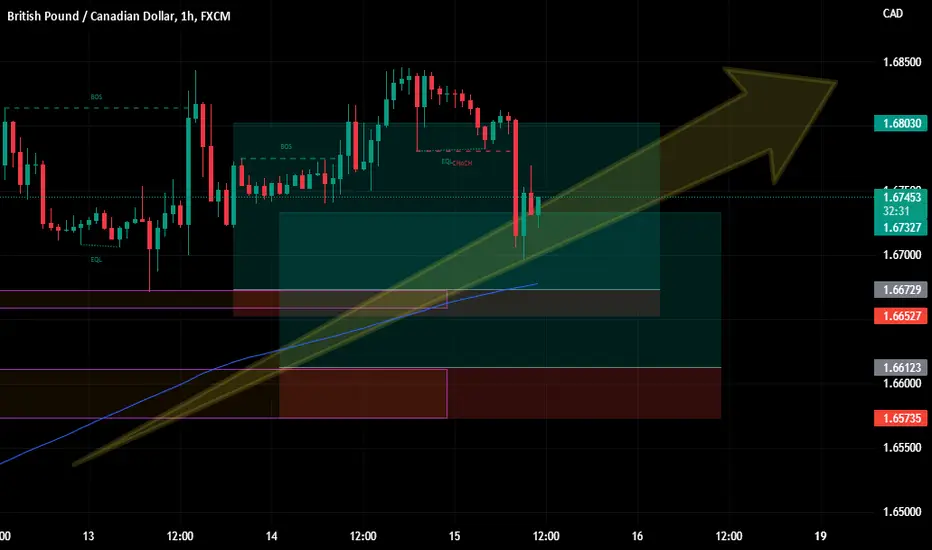
GBP/CAD LONG TRADE ...According to SMC , We have a two trades entry for long on GBP/CAD pair as following :
TRADE 1:
ENTRY @ 1.66729
SL @ 1.66527
TP @ 1.68030
RRR : 1:6.44
TRADE 2:
ENTRY @ 1.66123
SL @ 1.65735
TP @ 1.67327
RRR : 1:3.1
IF 1ST TRADDE IS ACTIVATED AND HIT TP , DON'T ENTER THE 2ND TRADE ...
GOOD LUCK GUYS ...
GBP/CAD LONG TRADE ...According to SMC , We have a two trades entry for long on GBP/CAD pair as following :
TRADE 1:
ENTRY @ 1.66526
SL @ 1.66364
TP @ 1.67080
RRR : 1:3.42
TRADE 2:
ENTRY @ 1.65868
SL @ 1.65724
TP @ 1.66484
RRR : 1:4.28
IF 1ST TRADDE IS ACTIVATED AND HIT TP , DON'T ENTER THE 2ND TRADE ...
GOOD LUCK GUYS ...

GBPCAD - Quick Scalp - Buy now! Let's scalp on GBPCAD!
Here's my entries:
🔷 Entry: 1.67300
✅ Take Profit: 1.67700
🔻 Stop Loss: 1.67120
This strategy is based on my 123 pattern retracement strategy!

GBPCAD weekly breakdownHello hello! After a bearish year for GBPCAD , it finally shifts on a weekly perspective, breaking the Moving Averages & EMAs finally crossed. For the past 3 weeks we saw a strong impulse on this pair, now waiting for a slow correction that can be followed by another strong impulse upwards. Moreover, the Commitment Of Traders data shows confluence on this analysis, GBP becoming stronger while CAD weakening.
We now have to wait in order to see a correction, and only after that we can be looking for an entrance!

GBPCAD top-down analysis, UPDATED!Hello traders, this is a complete multiple timeframe analysis of this pair. We see could find significant trading opportunities as per analysis upon price action confirmation we may take this trade. Smash the like button if you find value in this analysis and drop a comment if you have any questions or let me know which pair to cover in my next analysis.

GBPCAD CHART ANALYSIS POSTED ON SUNDAY 20 NOVEMBER 2022GBPCAD CHART ANALYSIS LONG!!!
Make sure you do your research and based on your confluence please look for the entry.
Trade safe use proper risk management always.

