GBPCAD potential reversal!
GBPCAD expected to rise up to 1st resistance at 1.60313 where it could potentially react off and drop down to 1st support at 1.59335.
Trading CFDs on margin carries high risk.
Losses can exceed the initial investment so please ensure you fully
understand the risks.
Gbpcadsell

GBPCAD DailyShorting opportunity with low risk, possible RR of 1:4 or higher depending on your own analysis and projection of price.
60 pip stop loss and 250 pip target minimum. Use your own trailing stop plan if this trade takes off.
Momentum and daily structure is behind this short. Price could swing up and take out the stop loss in order to grab sellers but
based on current market movement the expectation is for another drop.

GBPCAD - LONG TERM SHORT POSSIBILITYDAILY DEMAND ZONE AND SUPPORT BROKEN THEN SELL TO THE NEXT DAILY DEMAND ZONE

GBPCAD, forecast on 4H-->>daily support broken
-->> strong downward momentum
-->> sell till next support level


GBPCAD SHORT D : Oblique trendline brokenGBPCAD SHORT D : Oblique trendline broken
BREAKOUT OF OBLIQUE TRENDLINE. Waiting for a retest.
ENTRY: 1.695
SL: 1.718
TP: 1.661

GBPCAD Buys...Here we have GBPCAD buys. Looking across the board at the pound pairs, we are at support and doesn't make sense to go lower since we've consolidated for days with no real change in brexit news. There is crude oil news out at 3PM today so stops will be rolled to breakeven in anticipation if we're in profits... Technically, we are at a LL on the weekly and daily, we need to pull up higher in order to continue down. If it's going to drop it will trade in this range anyway until some news moves it...


British Pound / Canadian Dollar GBPCAD to SELLRSI signalling overbought area.
Market is SELLING.
Market often forms a double bottom/top to signal trend reversal so look out for this.

GBPCAD Approaching TrendLine Resistance: Potential SELLGBPCAD is approaching Trend Line Resistance which has stopped the price multiple times.
So, traders can look to sell GBPCAD at 1.7467-1.7480 area with SL above 1.7520.
TPs can be set at 1.7400 and 1.7350 area. This is a low-risk set-up.
For real-time FREE SIGNALS, check my signature(link)at the bottom of this page.

SELL GBPCAD ON 30MAnticipating shift in trend downwards as price action demonstrates a strong momentum swing down. Additionally, MACD + Triple Time Frame RSI provide additional support for my idea


GBP/CAD: Sell After Breakout !!BUY & SELL Above Given Chart or
You Can Also set Own Risk reward.
Let see what Will be Next Move.
Warning- I m Not a Financial Advisor this idea Only For Educational Purpose Only.
Thank You !!


#GBPCAD Signals+AnalysisLast week the gbpcad rose 350 pips and touched a moving average of 200, The moving average 200 usually will constitute resistance that is not easy to break that is the reason for the buy recommendation
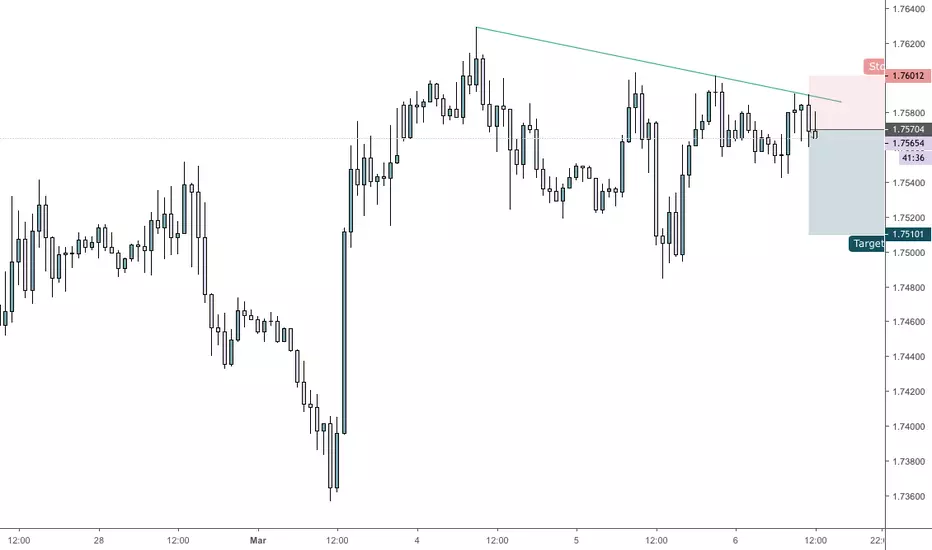
Sell GBPCAD:
Entry Price: 1.7660
Stop Loss:1.7730
Take Profit: 1.7460


Respect the pipin ( Snoop Dogg fans will understand ) ;p 1.72507 is a key strong resistance level as we show with our purple arrows where price has respected this level.
1.70319 area was previously used as resistance ( blue arrows ) but more recently was used as support ( orange arrows )
Price is currently sitting at resistance so again we are expecting it to respect this and bounce making movement to the downside, Price could find support around 1.71447 but eventually we are expecting price to fall to 1.70319 area.
We will be setting orders and sending ENTRY, SL and TP to our clients.

GBPCAD - SELL BREAK OUT - DONT MISS ITTWATCH OUT FOR THE BREAK OUT
See previous analysis
PLEASE SUPPORT THE MOVEMENT WITH YOUR LIKES, COMMENTS AND FOLLOW FOR MORE

GBPCADA lot of 4h divergence. This could play both way, but is a critical level. If impulse to the downside starts, then we could have a really big movement on Daily
