GBPCAD - UPDATE - WATCH FOR BREAK DOWNWatch Top for reversal - Resistance
Top also 0.618 Fib Retracement level
Gbpcadsell


GBPCAD SellGBPCAD is still within the range. we anticipate a move possibly towards the bottom of the channel

GBPCAD| 1HR| SELL ==> FIND THIS USEFUL?: LEAVE A LIKE AND FOLLOW
==> OTHER THOUGHTS?: COMMENT SO WE DISCUSS

GBPCAD rejected its trend lineRespected followers, yesterday GBPCAD rejected its trend line to move down. We can sell this pair at current market price. Trade at your own risk.

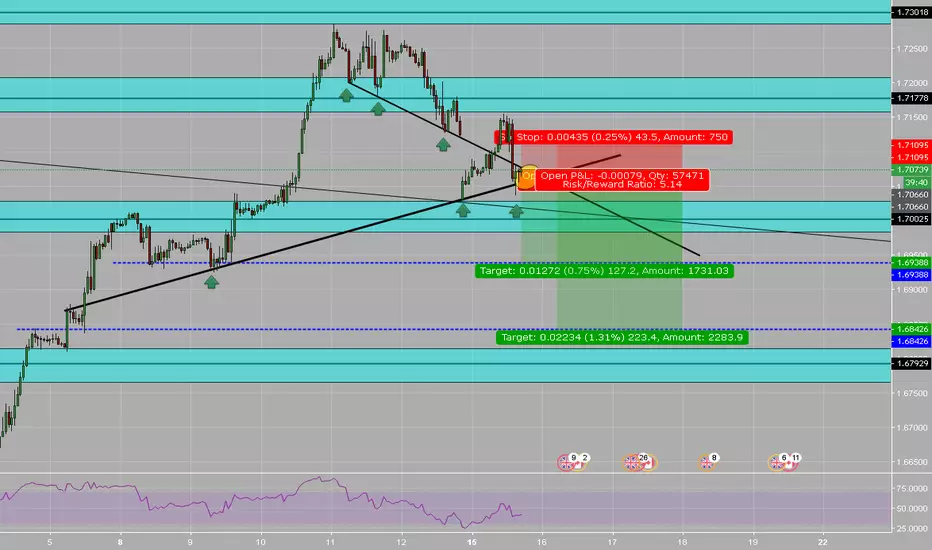
GBPCAD - SHORT TO BUY - > :)GBPCAD IS NOW COMPLETING A REVERSAL
WAIT FOR THIS TO COMPLETE AND THEN
ENTER FOR THE LONG
SUPPORT THE MOVEMENT WITH YOUR LIKES,
COMMENTS AND FOLLOW FOR MORE

GBPCAD UPDATE - watch this for dropGBPCAD has retraced to Nicely on this.
i am expecting it to break down soon, so keep
you eye out for this one.
See previous analysis
I APPRECIATE ALL LIKES, COMMENTS AND FOLLOW FOR MORE


GBPCAD - short again at H1GBPCAD has a rule symmetry wave at the wave 2.
Look left, The Reversal was at 44.6 fibo.
Thus, I predict GBPCAD will down with 5 waves to complete the Bat Harmonic.
Tp1: 1.68219, TP2: 1.66660
Stop loss: 1.71882

GBPCAD - BROKE THE CONSOLIDATION - SHORT OPPORTUNITYThe price made a triple top within the downtrend line on the daily chart. After it, it broke the consolidation and now came back for the retest, already showing signs that the sellers are coming back to the game. I`m gonna wait for a strong price action and then I`m going short.

GBPCAD - short at H1The last top has reached the Zone of Daily wave
Should to sell follow the Reversal signal (drop beyond 120 fibo Extension)
Sell from the wave 2 to wave 3

Short idea for GBPCADGBPCAD is down trending due to printing LHs & LLs, and it is moving in a descending channel, recently price action seems to print a new LH as a typical counter-trend and has reached to upper down trend channel and then inner counter trend line has broken and pulled back to near it, also forming a Head and Shoulder pattern is possible.
All in all this is an short idea and it would be triggered if we could see price break local pullback trend line in lower time frames (for example H1).

GBPCAD Bearish Harmonic Pattern and Strong Resistance above!GBPCAD will fall soon after hitting the Strong resistance line or after completing the harmonic pattern.

GBPCAD Short Trading Idea (H&S - Sell The Retest)This research is for informational purposes and should not be construed as personal advice. Trading any financial market involves risk. Trading on leverage involves risk of losses greater than deposits.


GBPCAD, Sell .H4:
- Trend: Downtrend
- Channel down
- Testing support daily--> breakout and closed below
--> Waiting pullback--> Given signal--> Sell
( Prior analysis GBPCAD www.tradingview.com )

GBPCAD, Sell.H4:
- Trend: Downtrend
- Channel down
- Testing support daily--> breakout and closed below
--> Waiting pullback--> Given signal--> Sell
( Prior analysis GBPCAD www.tradingview.com )

GBPCAD Sell setupGBPCAD accelerating in a multi-days bearish channel, with succession of lower top, i am expecting it to make a new low over the coming days, since momentum indicators are suggesting the view as well, if you have your trading strategy, look for short plays.
Happy Trading.

GBP/CAD - 200 Pips+ Bearish Move OpportunityGBP/CAD wasn't able to keep up with the bullish daily trend move and moved under the 50 ema once again.
It is now not showing any good signs of support and is barely able to keep it's current level. It's making more lows.
I expect a break below the current support zone to happen within the next 48 hours.
A good move to keep an eye one.
Happy trading! Follow your rules!


GBPCAD Short The bears are definitely in control of this market. Price has made its way back up to former support and can be now identified as resistance. What makes this setup so attractive is the fact that there is a "Shooting Star". With this retest we can be sure to enter short positions and ride all the way down to the 1.68000 area.

GBPCAD Peaking followed by minor signs of dropping Hi Guys,
If we Look at this chart, there seems to be a reversal at 1,8048 followed with a drop. Hence, i think we can start to short GBPCAD.
Be aware that this chart still has an upward trend and if we draw diagonal line from the bottom to the top, I would expect some retracement period at 1,7410, so you can take some profit here.
IF this this chart passes the line followed by a pullback, i would target the 0.5 level, but if there is major resistance at the upward trend line, i would close this trade with the profit.
Let's see where it goes
T/P1 at 1,7410
T/P2 at 1,6939
S/L at 1.8070
Please don't risk more than 2% of your capital
Hope you get some profit from this idea
Cheers!
