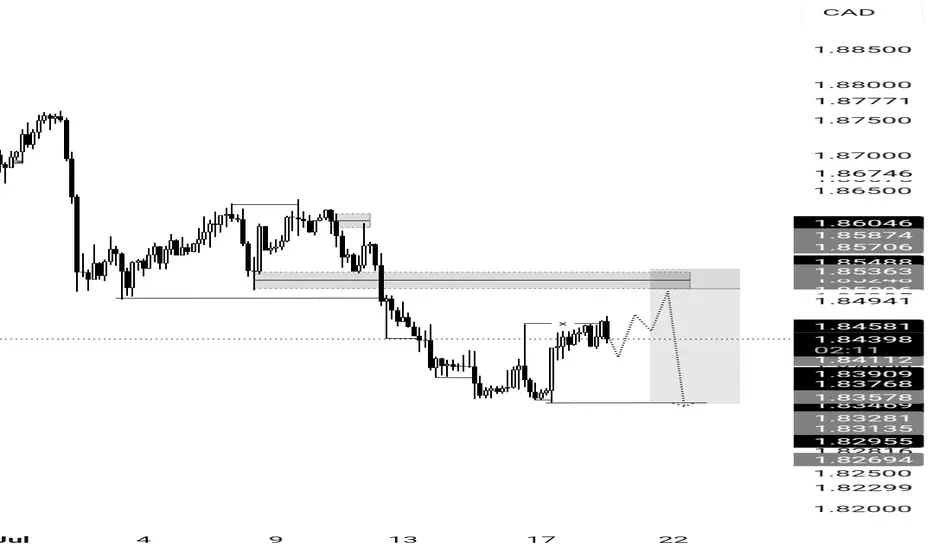
GBP/CAD - H4 - Bearish Flag (26.07.2025)The GBP/CAD Pair on the H4 timeframe presents a Potential Selling Opportunity due to a recent Formation of a Bearish Flag Pattern. This suggests a shift in momentum towards the downside in the coming Days.
Possible Short Trade:
Entry: Consider Entering A Short Position around Trendline Of The Pattern.
Target Levels:
1st Support – 1.8242
2nd Support – 1.8139
🎁 Please hit the like button and
🎁 Leave a comment to support for My Post !
Your likes and comments are incredibly motivating and will encourage me to share more analysis with you.
Best Regards, KABHI_TA_TRADING
Thank you.
Disclosure: I am part of Trade Nation's Influencer program and receive a monthly fee for using their TradingView charts in my analysis.
Gbpcadshort

GBP/CAD Downtrend Setup – Clean Heist Entry Strategy🔥💷💣 THE GBP/CAD FOREX HEIST PLAN 💣💷🔥
Thief Trader Style – "Rob the Market, Not Each Other"
🧠 Smart Strategy | 🔍 Deep Analysis | 🎯 High Probability Plays | ⚔️ Risk-Controlled Attack
🌍 Hi! Hola! Ola! Bonjour! Hallo! Marhaba!
Dear Money Makers & Market Robbers, 🤑💰✈️
Welcome to another legendary forex robbery mission – this time, we’re planning the ultimate Pound vs. Loonie Heist (GBP/CAD). Powered by Thief Trading’s precision analysis (both technical & fundamental), this setup is designed for disciplined, stealthy traders who know how to attack at the right moment. Let’s take what’s ours from the market – the Thief way.
🔫 THE SETUP: GBP/CAD MARKET RAID
We’re eyeing a Short Entry near 1.83700 after the Moving Average Breakout Confirmation.
This ain’t just any pullback – this is a trap zone, a Police Barricade ATR Blue Zone, where liquidity fakes out the greedy bulls and invites a high-probability short for those with a thief’s vision.
Chart structure screams: overbought, slowing momentum, divergence + confluence = Bear Attack.
📍 Entry Plan:
💥 “The Heist is ON! Wait for the MA break… Then make your move at 1.83700!”
☑️ Sell Stop Orders – Just above the Moving Average or after key Support Break
☑️ Sell Limit Orders – For pullbacks at 15m or 30m TF near SWING H/L
☑️ Layered Entries / DCA Style – Multiple small entries for maximum control
☑️ Set Alerts! – Chart alarms keep your eyes sharp, your entries sharper.
🚨 Stop Loss Protocol (SL):
🛑 “No SL before breakout. You place early – you get burned.”
🗡️ After Breakout ONLY: SL near 1.84500, 4H Swing High
🛡️ Adapt based on your risk %, lot size, and number of open orders
🤫 Pro Tip: Smart SLs protect you, not limit you. Be like a ghost in the market.
🎯 Target Zone (TP):
📉 Initial Target: 1.82100
💨 “Get in, grab the bag, get out.”
You’re a thief – no greed, just precision. Exit before the alarms ring if the market flips!
🔎 Macro Factors Fueling the Bear Trend:
📉 Hawkish BOC tones down, GDP data contraction vibes
📈 GBP sentiment mixed; technical overbought signals dominate
🎭 Consolidation breakdown = High-Reward Entry Window
📰 News Awareness = Smart Survival:
⚠️ Avoid New Trades During Major News
📍 Use Trailing SLs to Protect Open Profits
🧨 Don’t get caught in the volatility trap – let the chaos work for you, not against you.
💥 BOOST THIS HEIST PLAN – ROBBERS UNITE 💥
Smash the “Boost” Button to power up our Thief Gang's momentum. Your support sharpens the edge for all fellow robbers in this daily market hustle.
🧠 Precision Plan
🧭 Risk-Aligned Entry
📈 Profitable Exit
That’s how Thief Traders operate.
🤑 Stay ready for the next drop. Another Forex bank is about to get robbed clean.
💣💰Let’s rob the charts – not each other.
— Thief Trader, Robbin’ with Logic & Style
🏴☠️📉📲

GBPCAD Q3 | D21 | W30 | Y25📊GBPCAD Q3 | D21 | W30 | Y25
Daily Forecast 🔍📅
Here’s a short diagnosis of the current chart setup 🧠📈
Higher time frame order blocks have been identified — these are our patient points of interest 🎯🧭.
It’s crucial to wait for a confirmed break of structure 🧱✅ before forming a directional bias.
This keeps us disciplined and aligned with what price action is truly telling us.
📈 Risk Management Protocols
🔑 Core principles:
Max 1% risk per trade
Only execute at pre-identified levels
Use alerts, not emotion
Stick to your RR plan — minimum 1:2
🧠 You’re not paid for how many trades you take, you’re paid for how well you manage risk.
🧠 Weekly FRGNT Insight
"Trade what the market gives, not what your ego wants."
Stay mechanical. Stay focused. Let the probabilities work.
FRGNT 📊

GBPCAD Bearish Flag Breakout!
HI,Traders !
#GBPCAD is trading in a local
Downtrend and formed a bearish
Flag pattern and now we are
Seeing a bearish breakout
So we are bearish biased
And we will be expecting
A further bearish move down !
Comment and subscribe to help us grow !

GBPCAD – WEEKLY FORECAST Q3 | W30 | Y25📊 GBPCAD – WEEKLY FORECAST
Q3 | W30 | Y25
Weekly Forecast 🔍📅
Here’s a short diagnosis of the current chart setup 🧠📈
Higher time frame order blocks have been identified — these are our patient points of interest 🎯🧭.
It’s crucial to wait for a confirmed break of structure 🧱✅ before forming a directional bias.
This keeps us disciplined and aligned with what price action is truly telling us.
📈 Risk Management Protocols
🔑 Core principles:
Max 1% risk per trade
Only execute at pre-identified levels
Use alerts, not emotion
Stick to your RR plan — minimum 1:2
🧠 You’re not paid for how many trades you take, you’re paid for how well you manage risk.
🧠 Weekly FRGNT Insight
"Trade what the market gives, not what your ego wants."
Stay mechanical. Stay focused. Let the probabilities work.
FRGNT FOREX ANALYSIS 📊

GBPCAD SELL IDEAFundamental:to cut rates thrice this year, in August, November and December. Money markets are pricing in a total of 48.6 basis points of BoE rate cuts by the year-end, with a 77.3% probability of a 25 basis point move in August.
Technical:A classical Breakerblock entry type to continue move lower
GBPCAD – Key Level, Buy Setup & Dual StrategyRight now, price is sitting on a major level.
📌 If a valid buy signal shows up, I’ll enter a long position.
But that’s not all…
🔁 If price reaches the next resistance level, I’ll:
Hold my long position
Open a short position there
This way: ✅ If price reverses → my long trade is closed by trailing stop
✅ And my short trade runs into profit
→ I profit both from below and above
⚠️ If my short trade’s SL hits, no worries —
My long is still open and growing in profit.
📈 But if the resistance breaks and we get a pullback,
➡️ I’ll activate pyramiding and build more position with zero added risk.

GBPCAD SHORT FORECAST Q3 D15 W29 Y25GBPCAD SHORT FORECAST Q3 D15 W29 Y25
Professional Risk Managers👋
Welcome back to another FRGNT chart update📈
Diving into some Forex setups using predominantly higher time frame order blocks alongside confirmation breaks of structure.
Let’s see what price action is telling us today! 👀
💡Here are some trade confluences📝
✅Daily Order block identified
✅4H Order Block identified
✅1H Order Block identified
🔑 Remember, to participate in trading comes always with a degree of risk, therefore as professional risk managers it remains vital that we stick to our risk management plan as well as our trading strategies.
📈The rest, we leave to the balance of probabilities.
💡Fail to plan. Plan to fail.
🏆It has always been that simple.
❤️Good luck with your trading journey, I shall see you at the very top.
🎯Trade consistent, FRGNT X

GBPCAD - Looking To Sell Pullbacks In The Short TermH1 - Strong bearish move.
No opposite signs.
Expecting further continuation lower until the two Fibonacci resistance zones hold.
If you enjoy this idea, don’t forget to LIKE 👍, FOLLOW ✅, SHARE 🙌, and COMMENT ✍! Drop your thoughts and charts below to keep the discussion going. Your support helps keep this content free and reach more people! 🚀
--------------------------------------------------------------------------------------------------------------------

GBP/CAD Very Near Selling Area , Ready To Get 200 Pips ?Here is my daily chart on GBP/CAD , We have a very good res area the price very near it now and i`m waiting for touch for this res area and then i will enter a sell trade and targeting 200 pips at least , just waiting the price to give ma a good bearish price action from my res area and then i will enter . if the price close with daily candle above my res then this idea will not be valid .

SHOT ON GBP/CADGBP/CAD has given nice rejection from a major supply area.
There is lots of imbalance to the downside.
I will be selling GBP/CAD looking to catch 100-200 pips to the next demand zone.

GBP/CAD Made A New Wave , Golden Place To Sell Very Clear !Here is my opinion on GBP/CAD 2H Chart . we have finally a good wave and the price made a new down trendline and moving very good , now i put my fibo indicator and i`m waiting the price to retest a broken support and also 71% fib level and give me any bearish price action and then we can enter a sell trade to create new lower low .

GBPCAD SELLBy utilizing levels, historical patterns, , we can formulate a hypothesis that the market might follow a similar trajectory if bearish sentiment prevails.

GBP/CAD "Pound vs Loonie" Forex Bank Money (Day Trade Plan)🌟Hi! Hola! Ola! Bonjour! Hallo! Marhaba!🌟
Dear Money Makers & Robbers, 🤑💰✈️
Based on 🔥Thief Trading style technical and fundamental analysis🔥, here is our master plan to heist the GBP/CAD "Pound vs Loonie" Forex Market. Please adhere to the strategy I've outlined in the chart, which emphasizes short entry. Our aim is the high-risk Blue MA Zone. Risky level, oversold market, consolidation, trend reversal, trap at the level where traders and bullish robbers are stronger. 🏆💸"Take profit and treat yourself, traders. You deserve it!💪🏆🎉
Entry 📈 : "The heist is on! Wait for the Neutral Level breakout then make your move at (1.83000) - Bearish profits await!"
however I advise to Place sell stop orders above the Moving average (or) after the Support level Place sell limit orders within a 15 or 30 minute timeframe most NEAREST (or) SWING low or high level for Pullback entries.
📌I strongly advise you to set an "alert (Alarm)" on your chart so you can see when the breakout entry occurs.
Stop Loss 🛑: "🔊 Yo, listen up! 🗣️ If you're lookin' to get in on a sell stop order, don't even think about settin' that stop loss till after the breakout 🚀. You feel me? Now, if you're smart, you'll place that stop loss where I told you to 📍, but if you're a rebel, you can put it wherever you like 🤪 - just don't say I didn't warn you ⚠️. You're playin' with fire 🔥, and it's your risk, not mine 👊."
📌Thief SL placed at the nearest/swing High or Low level Using the 4H timeframe (1.84500) Day/Scalping trade basis.
📌SL is based on your risk of the trade, lot size and how many multiple orders you have to take.
Target 🎯: 1.81000 (or) Escape Before the Target
💰💵💸GBP/CAD "Pound vs Loonie" Forex Market Heist Plan (Scalping/Day Trade) is currently experiencing a Bearish trend.., driven by several key factors.👇👇👇
⚠️Trading Alert : News Releases and Position Management 📰 🗞️ 🚫🚏
As a reminder, news releases can have a significant impact on market prices and volatility. To minimize potential losses and protect your running positions,
we recommend the following:
Avoid taking new trades during news releases
Use trailing stop-loss orders to protect your running positions and lock in profits
💖Supporting our robbery plan 💥Hit the Boost Button💥 will enable us to effortlessly make and steal money 💰💵. Boost the strength of our robbery team. Every day in this market make money with ease by using the Thief Trading Style.🏆💪🤝❤️🎉🚀
I'll see you soon with another heist plan, so stay tuned 🤑🐱👤🤗🤩

Possible Bearish Reversal on GBPCAD | 4H Key ResistancePrice is currently testing a key resistance area near 1.86828 – 1.88313 (marked as Invalid Level).
The market structure shows a potential double top and signs of exhaustion.
Bias: Bearish reversal
Entry Zone: Around 1.86828
Invalidation: Break and close above 1.88313
Target (TP): 1.70447
A rejection from this resistance could signal a strong move to the downside. Wait for confirmation (e.g., bearish engulfing, break of structure) before entering. Manage risk accordingly.
Disclaimer: This analysis is for educational purposes only and does not constitute financial advice. Always do your own research and manage risk according to your trading plan.

Mon 5th May 2025 GBP/CAD Daily Forex Chart Sell SetupGood morning fellow traders. On my Daily Forex charts using the High Probability & Divergence trading methods from my books, I have identified a new trade setup this morning. As usual, you can read my notes on the chart for my thoughts on this setup. The trade being a GBP/CAD Sell. Enjoy the day all. Cheers. Jim

GBP/CAD "Pound vs Loonie" Forex Bank Heist Plan (Swing/Day)🌟Hi! Hola! Ola! Bonjour! Hallo! Marhaba!🌟
Dear Money Makers & Robbers, 🤑💰✈️
Based on 🔥Thief Trading style technical and fundamental analysis🔥, here is our master plan to heist the GBP/CAD "Pound vs Loonie" Forex Bank. Please adhere to the strategy I've outlined in the chart, which emphasizes long entry and short entry. 🏆💸"Take profit and treat yourself, traders. You deserve it!"💪🏆🎉
Entry 📈 :
"The loot's within reach! Wait for the breakout, then grab your share - whether you're a Bullish thief or a Bearish bandit!"
🏁Buy entry above 1.85100
🏁Sell Entry below 1.83000
📌However, I recommended to place buy stop for bullish side and sell stop for bearish side.
Stop Loss 🛑: "🔊 Yo, listen up! 🗣️ If you're lookin' to get in on a buy (or) sell stop order, don't even think about settin' that stop loss till after the breakout 🚀. You feel me? Now, if you're smart, you'll place that stop loss where I told you to 📍, but if you're a rebel, you can put it wherever you like 🤪 - just don't say I didn't warn you ⚠️. You're playin' with fire 🔥, and it's your risk, not mine 👊."
🚩Thief SL placed at 1.83000 (swing Trade Basis) for Bullish Trade
🚩Thief SL placed at 1.84000 (swing Trade Basis) for Bearish Trade
Using the 3H period, the recent / swing low or high level.
SL is based on your risk of the trade, lot size and how many multiple orders you have to take.
Target 🎯:
🏴☠️Bullish Robbers : TP 1.88500 (or) Escape Before the Target
🏴☠️Bearish Robbers : TP 1.80000 (or) Escape Before the Target
⚒💰GBP/CAD "Pound vs Loonie" Forex Bank Heist Plan is currently experiencing a neutral trend (there is a chance to move Bullishness🐂)... driven by several key factors.... ☝☝☝ 👇👇👇
📰🗞️Get & Read the Fundamental, Macro Economics, COT Report, Quantitative Analysis, Sentimental Outlook, Intermarket Analysis, Future trend targets & Overall Score... go ahead to check 👉👉👉🔗🔗
📌Keep in mind that these factors can change rapidly, and it's essential to stay up-to-date with market developments and adjust your analysis accordingly.
⚠️Trading Alert : News Releases and Position Management 📰 🗞️ 🚫🚏
As a reminder, news releases can have a significant impact on market prices and volatility. To minimize potential losses and protect your running positions,
we recommend the following:
Avoid taking new trades during news releases
Use trailing stop-loss orders to protect your running positions and lock in profits
💖Supporting our robbery plan 💥Hit the Boost Button💥 will enable us to effortlessly make and steal money 💰💵. Boost the strength of our robbery team. Every day in this market make money with ease by using the Thief Trading Style.🏆💪🤝❤️🎉🚀
I'll see you soon with another heist plan, so stay tuned 🤑🐱👤🤗🤩

GBPCAD trade ideaFX:GBPCAD
Potential short opportunity as price reaches Swap zone and closed with few rejection candles, signaling potential short-term reversal. Price previously respected the HTF Resistance zone, this is an extra confluence that it may continue its bearish order flow towards the downside. For scalping and intraday, we can target the H1 demand zone below and turn trade into breakeven if holding for longer time.

GBPCAD Tests Bearish Trendline – Focus Shifts to BoC DecisionGBPCAD is currently respecting a well-defined descending trendline, showing multiple rejections and a sustained series of lower highs. The latest retest near 1.8460 was met with selling pressure, aligning with the broader bearish channel.
Key Levels:
Current Price: 1.8458
Resistance Area: 1.8470 – 1.8600 (trendline & previous highs)
Support Targets:
TP1: 1.8120 (key structure)
TP2: 1.7980
TP3: 1.7900 (major support zone)
Bearish Technical Confluence:
✅ Multiple rejections at trendline
✅ Lower highs & lower lows continue
✅ Potential reversal candlestick pattern forming
✅ Bearish breakout could accelerate toward 1.7980
📉 Fundamental Outlook – BoC Rate Decision in Focus (April 16)
Market Sentiment Split:
Initially, economists leaned toward a BoC hold, as recent data and trade optimism gave the central bank room to pause.
However, March CPI undershot expectations, triggering increased speculation of a rate cut.
Key Data Highlights:
Headline CPI fell to 2.3% YoY vs 2.6% previously, well below the 2.7% forecast.
Drop mainly due to gasoline and transport costs, which BoC may look through.
Core inflation (median 2.9%, trimmed 2.8%) remains elevated, supporting arguments for a hold.
Analyst Viewpoint:
“We still marginally favor a BoC hold given the proximity to elections and resilience in core inflation, but our conviction is lower after the CPI miss.” – Knightley & Pesole, ING
Market Reaction:
Loonie sold off post-CPI, but analysts believe the sell-off may be short-lived if BoC surprises with a hawkish hold.
Swap market odds of a cut rose to 45%, up from 33% pre-CPI.
🎯 Combined Technical + Fundamental Setup
If BoC holds rates, expect CAD strength → GBPCAD could accelerate downward toward 1.8120 → 1.7900.
If BoC cuts, GBPCAD may spike temporarily toward 1.8600, but downside pressure may resume unless accompanied by dovish forward guidance.
🛠️ Trade Plan:
Sell Bias Below: 1.8470
Entry Trigger: Bearish confirmation or post-BoC rejection
TP1: 1.8120
TP2: 1.7980
TP3: 1.7900
Invalidation Zone: Break and close above 1.8600

SHORT ON GBP/CADGBP/CAD is currently in the pullback phase of its overall uptrend.
Its has given a perfect BOS (break of structure) to the downside followed by a perfect retest of the supply area that created the BOS.
I will be selling GBP/CAD to the next demand level for a 500-600 pip move.

gbpcad swing sell following market structureas always the trend is always your friend here in this senerio we have a simple smc concept and a breaker block as our poi, since all condition is met am shorting this trade..... 1:8 RR quite cool right? check me out on tiktok equal fx.

GBP/CAD At Interesting Area To Sell It And Get 250 Pips !This Is An Educational + Analytic Content That Will Teach Why And How To Enter A Trade
Make Sure You Watch The Price Action Closely In Each Analysis As This Is A Very Important Part Of Our Method
Disclaimer : This Analysis Can Change At Anytime Without Notice And It Is Only For The Purpose Of Assisting Traders To Make Independent Investments Decisions.

Short Idea On GBPCADBased On :
- Cycles and quantitative analysis
- supply zone
- Small speculators buying at extremes so we do the opposite
