GBPCAD Local Bullish Bias!GBP-CAD broke out of
The range and the breakout
Is confirmed so now we are
Locally bullish biased
And we will be expecting
A move up towards the
Target of 1.73284 !
Gbpcadsignal

GBPCAD I Buyers struggling to break 7145 I This could happenWelcome back! Let me know your thoughts in the comments!
** GBPCAD Analysis - Listen to video!
We recommend that you keep this pair on your watchlist and enter when the entry criteria of your strategy is met.
Please support this idea with a LIKE and COMMENT if you find it useful and Click "Follow" on our profile if you'd like these trade ideas delivered straight to your email in the future.
Thanks for your continued support!

GBPCAD ____ INCOMING BULLISH MOVEHello Traders,
Just like my EURCAD analysis (inserted below), GBPCAD has also aligned on the monthly, weekly, and daily timeframes. Just like EURCAD also, GBPCAD did not trade into the weekly order block before the daily chart printed a bullish price structure and as I stated in my EURCAD analysis, it is not necessary.
GBPCAD printed a bullish CHOCH on the daily chart which retraced and reacted nicely. I have adjusted my daily order block accordingly and I am waiting for the price to retrace into the order block to go long. Although I am speculating on higher price movement, if I am able to enter the trade, I will look to exit at the daily supply order block.
Follow for more updates like this.
EURCAD ANALYSIS
Cheers,
Jabaro

DeGRAM | GBPCAD confluence level for sellGBPCAD broke and closed below the psychological level 1.7000.
Price pulled back to psychological level and 50% fibo retracement following bearish move.
If the price action creates a pinbar or double top, we can look for selling opportunities.
Price action is likely to go further down to complete the AB=CD pattern if the market moves down.
-------------------
Share your opinion in the comments and support the idea with like. Thanks for your support!

GBPCAD Analysis 31July2023After a change in the market structure, I still see this pair in a bearish condition. With the bearish target that is still the same as the past analysis.

GBPCAD, Expecting DownGBPCAD, I am expecting down move from H2 order block which is looking very strong to continue the down trend.

7 Dimension Analysis For GBPCAD 😇7 Dimension Analysis - Bullish Setup on GBP/CAD
Analysis Time Frame: Daily
1: Price Structure:
The market is currently exhibiting a bullish price structure, characterized by an initial Behavior of BoS (Breakout of Support). The move is impulsive, and the inducement is completed with liquidity swept internally. This is the 1st pullback in the bullish move, and the extreme order block (OB) remains unmitigated. Strong bullish momentum is evident around the demand area.
2: Patterns:
🟢TREND LINES:
A horizontal support line is observed, acting as a key level of support.
🟢CHART PATTERNS:
A double top pattern with an impulsive breakout and heavy volume is in place.
A rectangle pattern has also broken out, with the previous resistance now becoming support.
A V-shaped swing indicates a rapid recovery.
🟢CANDLE PATTERNS:
A key reversal pattern has formed, signaling a potential trend reversal.
A record session count of 4 candles is observed, indicating strong bullish momentum.
A change in guard pattern has appeared.
Momentum has failed to sustain a clear direction.
3: Volume:
Volume on the breakout was not significant, but after the breakout, big volume appeared as a follow-up.
Volume during the correction phase is average.
4: Momentum UNCONVENTIONAL Rsi:
🟢The Unconventional RSI is currently in a sideways zone.
🟢Divergence is evident.
🟢Confirmation is needed for a breakout above the 60 level or resistance.
5: Volatility measure Bollinger bands:
🟢Prices are taking support at the middle band, indicating its significance as a support/resistance level.
🟢A squeeze breakout occurred, going outside the upper band, and prices have already done a "Walking on the band" move, indicating bullish momentum.
🟢A headfake pattern is clearly visible at the low of the previous move.
🟢Dual band derivation suggests that confirmation may take 1 or 2 more days.
6: Strength ADX:
The ADX is in a "kiss and cross" position, but the main line is above 20, indicating that bulls are still in strength.
7: Sentiment ROC:
The rate of change for GBP against CAD is positive, indicating GBP strength.
✔️ Entry Time Frame: H1
✅ Entry TF Structure: The current structure is bearish, but as 4 pullbacks are already counted, there is a high chance that the price can change structure. It is advisable to enter once the choch is done, as the low is already confirmed.
☑️ Entry Move: Impulsive
✔ Support Resistance Base: Trend line now acts as support.
➕ FIB: Activated
↕️ Trend Line Breakout: Broken.
☑️ Final Comments: Consider buying.
💡 Decision: Buy.
🚀 Entry: 1.7040 (1st option), 1.6860 (2nd option).
✋ Stop Loss: 1.6795
🎯 Take Profit: 1.7637
😊 Risk to Reward Ratio: 1:11
🕛 Expected Duration: 30 days.

GBPCAD Analysis 21July2023after the price formed a bullish channel and was broken by the bearish trend by forming CHoCH, currently the price is in the resistance area and there is a possibility for a correction to rise again to the upper SnD area before continuing its bearish trend.

GBPCAD : Short Trade , 1hHello traders, we want to check the GBPCAD chart. After an upward move, the price has broken the ascending channel and also a range zone. The price is pulling back to the bottom of the range zone and we expect this zone to maintain the downward trend of the price. And it is a good entry point to enter the sale transaction. If the price falls, we expect the price to fall around 1.71800. Good luck.

GBPCAD Analysis H1Here is my analysis for GBPCAD on H1 using Order Block. The price could go bullish, you can put a pending order on the Order block or find an entry on LTF within OB Zone. Trade Safe!

DeGRAM | GBPCAD trend continuation opportunityGBPCAD market is trading in an ascending channel.
Price making higher highs and higher closes, and it's approaching a major resistance and psychological level 1.73000.
We expect a pullback to the support level and a buy opportunity from it.
Breakout the resistance, pullback to support, and continuation.
-------------------
Share your opinion in the comments and support the idea with like. Thanks for your support!

GBPCAD Idea H1Here is my analysis for GBPCAD on H1 using Order Block. The price could go bullish, you can put a pending order on the Order block or find an entry on LTF within OB Zone. Trade Safe!

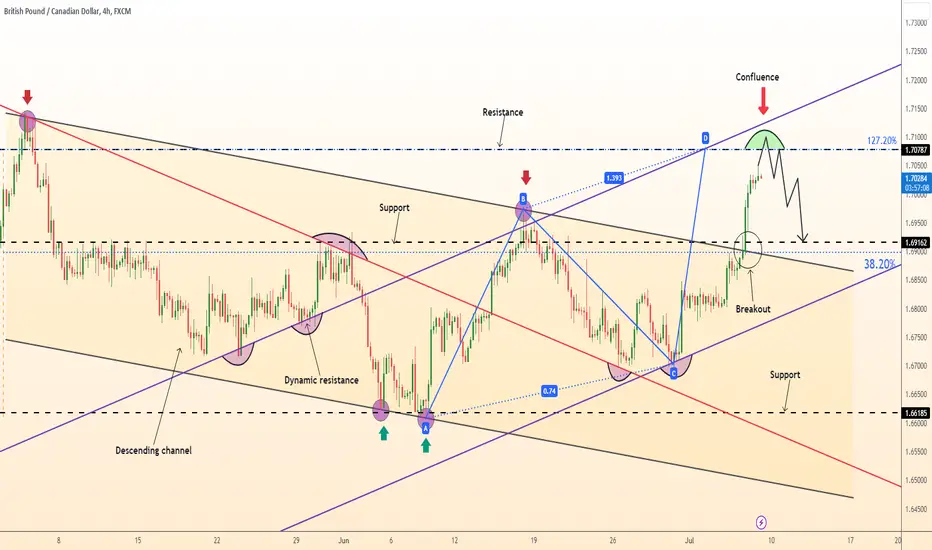
DeGRAM | GBPCAD confluence levelGBPCAD breakout of the ascending channel and it moving to psychological level at 1.71000
The market is approaching the resistance level as well as the fibo extension level.
If price rejects the resistance level by creating a false break, then it is likely to pullback from the confluence .
-------------------
Share your opinion in the comments and support the idea with like. Thanks for your support!
GBPCAD Forecast 4July2024the price has broken the bearish trendline, with a fairly thick bullish candle and currently looks sideways. there is a possibility that the price will retest back to the trendline area before continuing the bullish trend.

DeGRAM | GBPCAD channel breakoutGBPCAD broke and closed below the psychological level at 1.68000.
The market broke the ascending channel, showing a trend shift.
Notice, price action approached the level by printing small candles, indicating that there's no strength to go higher.
Price action is likely to pullback to the resistance level and go further down.
-------------------
Share your opinion in the comments and support the idea with like. Thanks for your support!

DeGRAM | GBPCAD selling opportunityGBPCAD broke and closed below the psychological level 1.6900.
By forming a pinbars, the market rejected local resistance and the 50.2% fibo.
Notice, price action approached the level by printing small candles, indicating that there's no strength to go higher.
Price action is likely to pullback to the support level and go further down.
-------------------
Share your opinion in the comments and support the idea with like. Thanks for your support!

GBPCAD Will Grow!GBP-CAD broke out of
The falling channel and
Then went down to retest horizontal resistance
It but is now growing again
So I think that we will see
A bullish move up !

GBPCAD Top-down analysis Hello traders, this is a complete multiple timeframe analysis of this pair. We see could find significant trading opportunities as per analysis upon price action confirmation we may take this trade. Smash the like button if you find value in this analysis and drop a comment if you have any questions or let me know which pair to cover in my next analysis.

GBPCAD Forecast 18June2023when the price enters the liquidty area ($$$) which is also the resistance area, there is a tendency for a pullback to occur.
For those of you who want to trade in this pair, it is better to wait whether the price will pull back or the price will breakout resistance.

DeGRAM | GBPCAD test of psychological level GBPCAD is decelerating at the support level. It created a double bottom.
Price action formed a divergence at the level, indicating buy pressure.
The market is testing the psychological level of 1.66000, and the fibo extension lines up with it.
We anticipate a bullish move.
-------------------
Share your opinion in the comments and support the idea with like. Thanks for your support!

GBPCAD Potential Short!GBP-CAD broke out of the
Horizontal range and also
Broke the rising support
So as it is now making
A pullback I think
There is a high chance
To see a move down !


GBPCAD H4 Triangle + 200 WMA Short Hi traders!
The current market conditions suggest a potential reversal in the GBP/CAD exchange rate, pointing towards a local downward trend. This strategic decision is in line with our analysis of a triangle pattern and downwards crossing the 200 period WMA on the H4 timeframe, which signals a favorable Short trading opportunity.
Have a great Weekend!
