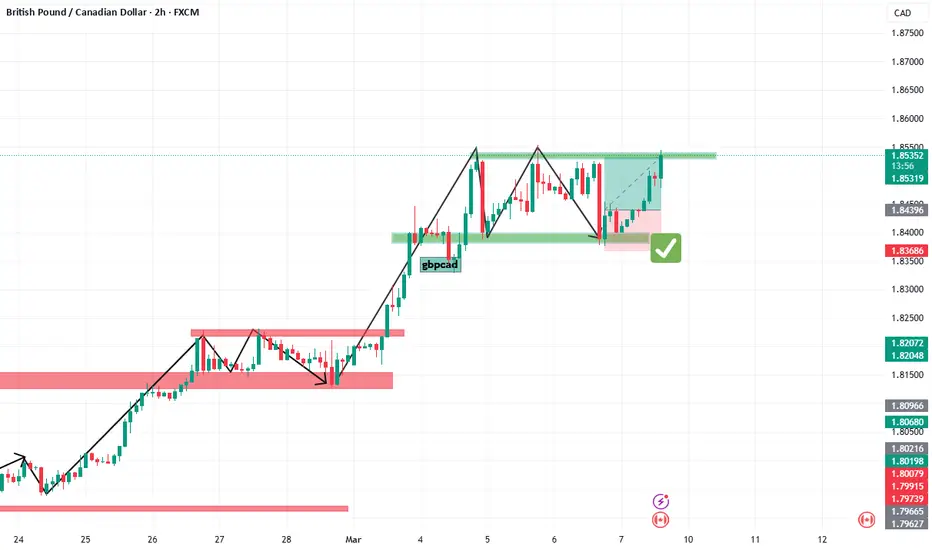
GBP/CAD "Pound vs Loonie" Forex Bank Money (Day Trade Plan)🌟Hi! Hola! Ola! Bonjour! Hallo! Marhaba!🌟
Dear Money Makers & Robbers, 🤑💰✈️
Based on 🔥Thief Trading style technical and fundamental analysis🔥, here is our master plan to heist the GBP/CAD "Pound vs Loonie" Forex Market. Please adhere to the strategy I've outlined in the chart, which emphasizes short entry. Our aim is the high-risk Blue MA Zone. Risky level, oversold market, consolidation, trend reversal, trap at the level where traders and bullish robbers are stronger. 🏆💸"Take profit and treat yourself, traders. You deserve it!💪🏆🎉
Entry 📈 : "The heist is on! Wait for the Neutral Level breakout then make your move at (1.83000) - Bearish profits await!"
however I advise to Place sell stop orders above the Moving average (or) after the Support level Place sell limit orders within a 15 or 30 minute timeframe most NEAREST (or) SWING low or high level for Pullback entries.
📌I strongly advise you to set an "alert (Alarm)" on your chart so you can see when the breakout entry occurs.
Stop Loss 🛑: "🔊 Yo, listen up! 🗣️ If you're lookin' to get in on a sell stop order, don't even think about settin' that stop loss till after the breakout 🚀. You feel me? Now, if you're smart, you'll place that stop loss where I told you to 📍, but if you're a rebel, you can put it wherever you like 🤪 - just don't say I didn't warn you ⚠️. You're playin' with fire 🔥, and it's your risk, not mine 👊."
📌Thief SL placed at the nearest/swing High or Low level Using the 4H timeframe (1.84500) Day/Scalping trade basis.
📌SL is based on your risk of the trade, lot size and how many multiple orders you have to take.
Target 🎯: 1.81000 (or) Escape Before the Target
💰💵💸GBP/CAD "Pound vs Loonie" Forex Market Heist Plan (Scalping/Day Trade) is currently experiencing a Bearish trend.., driven by several key factors.👇👇👇
⚠️Trading Alert : News Releases and Position Management 📰 🗞️ 🚫🚏
As a reminder, news releases can have a significant impact on market prices and volatility. To minimize potential losses and protect your running positions,
we recommend the following:
Avoid taking new trades during news releases
Use trailing stop-loss orders to protect your running positions and lock in profits
💖Supporting our robbery plan 💥Hit the Boost Button💥 will enable us to effortlessly make and steal money 💰💵. Boost the strength of our robbery team. Every day in this market make money with ease by using the Thief Trading Style.🏆💪🤝❤️🎉🚀
I'll see you soon with another heist plan, so stay tuned 🤑🐱👤🤗🤩
Gbpcadsignals

GBPCAD BUY/LONG TM 2HBy utilizing Fibonacci retracement levels, historical patterns, , we can formulate a hypothesis that the market might follow a similar trajectory if bullish sentiment prevails.

gbpcad resultgbpcad target hited.
This currency pair was in an uptrend and the target was touched.
thanks for support
GBP/CAD "Pound vs Canadian" Forex Market Bullish Heist Plan🌟Hi! Hola! Ola! Bonjour! Hallo!🌟
Dear Money Makers & Thieves, 🤑 💰🐱👤
Based on 🔥Thief Trading style technical and fundamental analysis🔥, here is our master plan to heist the GBP/CAD "Pound vs Canadian" Forex market. Please adhere to the strategy I've outlined in the chart, which emphasizes long entry. Our aim is the high-risk Red Zone. Risky level, overbought market, consolidation, trend reversal, trap at the level where traders and bearish robbers are stronger. 🏆💸Be wealthy and safe trade.💪🏆🎉
Entry 📈 : "The vault is wide open! Swipe the Bullish loot at any price - the heist is on!
however I advise placing Buy Stop Orders above the breakout MA or Place Buy limit orders within a 15 or 30 minute timeframe. Entry from the most re cent or closest low or high level should be in retest.
Stop Loss 🛑: Thief SL placed at the recent / nearest low level Using the 4H timeframe,
SL is based on your risk of the trade, lot size and how many multiple orders you have to take.
Target 🎯: 1.85000 (or) Escape Before the Target
Scalpers, take note 👀 : only scalp on the Long side. If you have a lot of money, you can go straight away; if not, you can join swing traders and carry out the robbery plan. Use trailing SL to safeguard your money 💰.
📰🗞️Fundamental, Macro, COT, Sentimental Outlook:
GBP/CAD "Pound vs Canadian" Forex Market is currently experiencing a Bullish trend., driven by several key factors.
🟡Fundamental Analysis:
The UK's economic growth has been slow, but the Bank of England's interest rate decisions may provide support for the pound. Canada's economy has been affected by the decline in oil prices, which may impact the Canadian dollar.
🔴Macroeconomic Factors:
UK Inflation: 2.5% (August), expected to remain low
Canada Inflation: 2.1% (July), expected to rise
UK Unemployment: 3.9% (July), expected to remain low
Canada Unemployment: 5.7% (July), expected to rise
UK GDP Growth: 1.0% (Q2), expected to slow down
Canada GDP Growth: 1.3% (Q2), expected to slow down
🟤COT Report:
The Commitment of Traders (COT) report shows that institutional traders are net long on the GBP/CAD pair, indicating a bullish sentiment.
🟣Market Sentiment:
Bullish: 65%
Bearish: 35%
Neutral: 0%
Retail Trader Sentiment:
Long: 70%
Short: 30%
Institutional Trader Sentiment:
Long: 60%
Short: 40%
🟢Overall Outlook:
The GBP/CAD pair is likely to continue its bullish trend, driven by the UK's economic growth prospects and the Bank of England's interest rate decisions. A strong break above the resistance level could confirm the uptrend.
⚠️Trading Alert : News Releases and Position Management 📰 🗞️ 🚫🚏
As a reminder, news releases can have a significant impact on market prices and volatility. To minimize potential losses and protect your running positions,
we recommend the following:
Avoid taking new trades during news releases
Use trailing stop-loss orders to protect your running positions and lock in profits
📌Please note that this is a general analysis and not personalized investment advice. It's essential to consider your own risk tolerance and market analysis before making any investment decisions.
📌Keep in mind that these factors can change rapidly, and it's essential to stay up-to-date with market developments and adjust your analysis accordingly.
💖Supporting our robbery plan will enable us to effortlessly make and steal money 💰💵 Tell your friends, Colleagues and family to follow, like, and share. Boost the strength of our robbery team. Every day in this market make money with ease by using the Thief Trading Style.🏆💪🤝❤️🎉🚀
I'll see you soon with another heist plan, so stay tuned 🤑🐱👤🤗🤩

GBP/CAD "Pound vs Canadian" Forex Market Bearish Heist Plan🌟Hi! Hola! Ola! Bonjour! Hallo!🌟
Dear Money Makers & Thieves, 🤑 💰🐱👤
Based on 🔥Thief Trading style technical and fundamental analysis🔥, here is our master plan to heist the GBP/CAD "Pound vs Canadian" Forex market. Please adhere to the strategy I've outlined in the chart, which emphasizes long entry. Our aim is the high-risk Red Zone. Risky level, overbought market, consolidation, trend reversal, trap at the level where traders and bearish robbers are stronger. 🏆💸Be wealthy and safe trade.💪🏆🎉
Entry 📈 : "The vault is wide open! Swipe the Bullish loot at any price - the heist is on!
however I advise placing Buy Stop Orders above the breakout MA or Place Buy limit orders within a 15 or 30 minute timeframe. Entry from the most re cent or closest low or high level should be in retest.
Stop Loss 🛑: Thief SL placed at the recent / nearest low level Using the 4H timeframe,
SL is based on your risk of the trade, lot size and how many multiple orders you have to take.
Target 🎯: 1.85000 (or) Escape Before the Target
Scalpers, take note 👀 : only scalp on the Long side. If you have a lot of money, you can go straight away; if not, you can join swing traders and carry out the robbery plan. Use trailing SL to safeguard your money 💰.
📰🗞️Fundamental, Macro, COT, Sentimental Outlook:
GBP/CAD "Pound vs Canadian" Forex Market is currently experiencing a Bullish trend., driven by several key factors.
🟡Fundamental Analysis:
The UK's economic growth has been slow, but the Bank of England's interest rate decisions may provide support for the pound. Canada's economy has been affected by the decline in oil prices, which may impact the Canadian dollar.
🔴Macroeconomic Factors:
UK Inflation: 2.5% (August), expected to remain low
Canada Inflation: 2.1% (July), expected to rise
UK Unemployment: 3.9% (July), expected to remain low
Canada Unemployment: 5.7% (July), expected to rise
UK GDP Growth: 1.0% (Q2), expected to slow down
Canada GDP Growth: 1.3% (Q2), expected to slow down
🟤COT Report:
The Commitment of Traders (COT) report shows that institutional traders are net long on the GBP/CAD pair, indicating a bullish sentiment.
🟣Market Sentiment:
Bullish: 65%
Bearish: 35%
Neutral: 0%
Retail Trader Sentiment:
Long: 70%
Short: 30%
Institutional Trader Sentiment:
Long: 60%
Short: 40%
🟢Overall Outlook:
The GBP/CAD pair is likely to continue its bullish trend, driven by the UK's economic growth prospects and the Bank of England's interest rate decisions. A strong break above the resistance level could confirm the uptrend.
⚠️Trading Alert : News Releases and Position Management 📰 🗞️ 🚫🚏
As a reminder, news releases can have a significant impact on market prices and volatility. To minimize potential losses and protect your running positions,
we recommend the following:
Avoid taking new trades during news releases
Use trailing stop-loss orders to protect your running positions and lock in profits
📌Please note that this is a general analysis and not personalized investment advice. It's essential to consider your own risk tolerance and market analysis before making any investment decisions.
📌Keep in mind that these factors can change rapidly, and it's essential to stay up-to-date with market developments and adjust your analysis accordingly.
💖Supporting our robbery plan will enable us to effortlessly make and steal money 💰💵 Tell your friends, Colleagues and family to follow, like, and share. Boost the strength of our robbery team. Every day in this market make money with ease by using the Thief Trading Style.🏆💪🤝❤️🎉🚀
I'll see you soon with another heist plan, so stay tuned 🤑🐱👤🤗🤩

#GBPCAD 1DAYGBPCAD (British Pound / Canadian Dollar)
Timeframe: Daily (1D)
Pattern: Channel
A descending price channel has been identified on the daily chart of the GBPCAD pair. This pattern is defined by two parallel trendlines—one acting as resistance (upper boundary) and the other as support (lower boundary)—with the price moving within these boundaries. The channel is sloping downward, indicating a bearish trend as the pair forms lower highs and lower lows.
Forecast: Sell
Based on the ongoing channel pattern, a selling opportunity is forecasted. The price is expected to continue moving lower within the confines of the channel, potentially offering an opportunity for traders to short the pair as it approaches the upper boundary.
Technical Outlook:
Resistance Zone: The upper boundary of the channel, where selling pressure may increase.
Support Zone: The lower boundary of the channel, which could act as a target for the downside movement.
Key Levels to Watch: A break below the lower boundary of the channel would signal further bearish momentum and could lead to a stronger sell-off.
Traders may look for bearish signals, such as rejection from the upper trendline or volume spikes during price declines, to confirm entry points.
External factors like commodity prices (oil, as CAD is commodity-sensitive) and economic data releases should be monitored, as they can impact the movement of this pair.

GBPCAD Waiting for the 1D MA200 to confirm the bottom.The GBPCAD pair broke this week below its 1D MA50 (blue trend-line) and is (including today) on a 2 day green streak. However this is technically not convincing for us to buy as despite holding the Internal Higher Lows trend-line, it is the 1D MA200 (orange trend-line) that has confirmed the major Higher Lows (bottoms) of the 11-month Channel Up.
In fact, it was a similar Internal Higher Lows trend-line that broke on April 01 2024 and despite a short-term rebound, broke downwards to confirm a bottom on the 1D MA200. As a result, we are waiting for that ideal technical opportunity to long and target 1.8000.
-------------------------------------------------------------------------------
** Please LIKE 👍, FOLLOW ✅, SHARE 🙌 and COMMENT ✍ if you enjoy this idea! Also share your ideas and charts in the comments section below! This is best way to keep it relevant, support us, keep the content here free and allow the idea to reach as many people as possible. **
-------------------------------------------------------------------------------
💸💸💸💸💸💸
👇 👇 👇 👇 👇 👇

GBPCAD About to test the 1D MA50. Sell opportunity.The GBPCAD pair is on the latest Bearish Leg of the underlying Channel Up (blue) pattern and is about to test the 1D MA50 (blue trend-line) for the first time since May 14. Once the 1D MA50 breaks, we expect a continuation of the Bearish Leg all the way to the bottom (Higher Lows trend-line) of the Channel Up.
Since 2023, -2.66% to -3.08% pull-backs have been common on this pair. As a result, we are looking towards the minimum -2.66% decline, which gives us a Target of 1.71500 and will make a technical Higher Low on the Channel.
-------------------------------------------------------------------------------
** Please LIKE 👍, FOLLOW ✅, SHARE 🙌 and COMMENT ✍ if you enjoy this idea! Also share your ideas and charts in the comments section below! This is best way to keep it relevant, support us, keep the content here free and allow the idea to reach as many people as possible. **
-------------------------------------------------------------------------------
💸💸💸💸💸💸
👇 👇 👇 👇 👇 👇

GBPCAD Local Short!GBP-CAD went up to
Retest a horizontal resistance
Of 1.7219 from where we are
Already seeing a bearish reaction
And I think that the pair will
Go further down !

GBPCAD Sell the spikeThe GBPCAD pair gave us a solid short-term sell signal last time (January 29, see chart below):
At the moment it is declining within a Channel Down pattern which emerged after the 6th rejection on the Resistance Zone. Having broken below both the 1D MA200 (orange trend-line) and 1D MA50 (blue trend-line), we are expecting a short-term rebound to price the new Lower High and fail on the 1D MA50 test as a Resistance.
There is a strong Support confluence below, the 0.618 Fibonacci retracement level and Support 1 (1.67685), our Target is at 1.6700, marginally below those on the dashed Higher Lows trend-line, always above the 1W MA100 (red trend-line).
-------------------------------------------------------------------------------
** Please LIKE 👍, FOLLOW ✅, SHARE 🙌 and COMMENT ✍ if you enjoy this idea! Also share your ideas and charts in the comments section below! This is best way to keep it relevant, support us, keep the content here free and allow the idea to reach as many people as possible. **
-------------------------------------------------------------------------------
💸💸💸💸💸💸
👇 👇 👇 👇 👇 👇

GBPCAD Bearish Breakout!GBP-CAD was trading along
The rising support line but
Now we are seeing a bearish
Breakout so I will be expecting
A bearish move down after
The local rebound !

GBPCAD Quadruple top on 1D?The GBPCAD pair delivered a solid buy trade last time we analyzed it (October 05 2023, see chart below), easily hitting the 1.71110 Target, on a structure rise:
The price is now signaling a bearish call as it has been rejected on the Lower Highs trend-line that started on the July 17 2023 High. This is technically a Quadruple Top if it stays that way and naturally there is strong sell potential behind it. The natural support levels are the 1D MA50 (blue trend-line) and 1D MA200 (orange trend-line), the latter of which is trading exactly on the Higher Lows trend-line, which is our first Target (1.6950).
If the price closes below the 1D MA200 and Higher Lows trend-line, we will re-short and target the 0.618 Fibonacci retracement level, which is just below Support 1. What makes selling a stronger probability right now is the formation of a 1D MACD Bearish Cross, which has been a sell signal with 100% accuracy for the whole 2023.
-------------------------------------------------------------------------------
** Please LIKE 👍, FOLLOW ✅, SHARE 🙌 and COMMENT ✍ if you enjoy this idea! Also share your ideas and charts in the comments section below! This is best way to keep it relevant, support us, keep the content here free and allow the idea to reach as many people as possible. **
-------------------------------------------------------------------------------
💸💸💸💸💸💸
👇 👇 👇 👇 👇 👇

GBPCAD: Bullish Trend-Following Setup 🇬🇧🇨🇦
GBPCAD is trading in a bullish trend.
The price formed an ascending triangle formation and violated its neckline
with a high momentum bullish candle.
That is a strong trend-following signal.
We can anticipate growth now to 1.725 level.
❤️Please, support my work with like, thank you!❤️

GBPCAD 15/01Pair : GBPCAD ( British Pound / Canada Dollar )
Description :
Completed " 12345 " Impulsive Waves and " ABC " Corrective Waves and making its Impulsive Waves. Bullish Channel as an Corrective Pattern in Short Time Frame wait for Rejection or Breakout. Strong Divergence in RSI

GBPCAD 05-12 Pair : GBPCAD ( British Pound / Canadian Dollar )
Description :
Bullish Channel as an Corrective Pattern in Long Time Frame and Rejection from the Lower Trend Line. It has completed the " 1234 " Impulsive it can break the Previous Resistance Level to complete its " 5th " wave at Upper Trend Line
Entry Precautions :
Wait for the Proper Rejection

GBPCAD Waiting for a bullish extension confirmation.The GBPCAD pair has been trading within a Bullish Megaphone for the whole year and is about to test the 1D MA200 (orange trend-line). The recent rebound is taking place on strong technicals as it not only started on the 1W MA100 (red trend-line) but also after a 1D MACD Bullish Cross from oversold levels that we haven't seen since July 2019.
If the 1D MA200 breaks and closes a 1D candle above it, the bullish extension will be confirmed and we will buy, targeting the 0.786 Fibonacci retracement level at 1.71110.
-------------------------------------------------------------------------------
** Please LIKE 👍, FOLLOW ✅, SHARE 🙌 and COMMENT ✍ if you enjoy this idea! Also share your ideas and charts in the comments section below! This is best way to keep it relevant, support us, keep the content here free and allow the idea to reach as many people as possible. **
-------------------------------------------------------------------------------
💸💸💸💸💸💸
👇 👇 👇 👇 👇 👇

GBPCAD Long Term BUYING Trading IdeaSep 13
Hello Traders
In This Chart GBPCAD HOURLY Forex Forecast By FOREX PLANET
today GBPCAD analysis 👆
🟢This Chart includes_ (GBPCAD market update)
🟢What is The Next Opportunity on GBPCAD Market
🟢how to Enter to the Valid Entry With Assurance Profit
This CHART is For Trader's that Want to Improve Their Technical Analysis Skills and Their Trading By Understanding How To Analyze The Market Using Multiple Timeframes and Understanding The Bigger Picture on the Charts

GBPCAD Analysis H4Here is my analysis for GBPCAD on H4 using Order Block. The price could go bullish, you can put a pending order on the Order block or find an entry on LTF within OB Zone. Trade Safe!

GBPCAD, Expecting DownGBPCAD, I am expecting down move from H2 order block which is looking very strong to continue the down trend.

GBPCAD Analysis H1Here is my analysis for GBPCAD on H1 using Order Block. The price could go bullish, you can put a pending order on the Order block or find an entry on LTF within OB Zone. Trade Safe!


GBPCAD Two break-out levels.GBPCAD reached the top of its multi-year Channel Down and got rejected, but found Support on the 1D MA50 (blue trend-line). Those two levels keep the price action neutral within a Triangle pattern.
The 1W MA300 (red trend-line) is right above the Channel Down and is in our opinion the buy break-out level, where you should go long and target the upper Resistances. On the other hand, every time the 1W RSI broke below its MA (yellow trend-line), the pair dropped. This is our sell break-out singal, with which we will target the 1D MA200 (orange trend-line).
-------------------------------------------------------------------------------
** Please LIKE 👍, FOLLOW ✅, SHARE 🙌 and COMMENT ✍ if you enjoy this idea! Also share your ideas and charts in the comments section below! **
-------------------------------------------------------------------------------
💸💸💸💸💸💸
👇 👇 👇 👇 👇 👇
