GBPCHF-Almost Good LongOk, so as I zoomed out to daily I see more reasons why I'm digging this trade. Resistance tested a few times than broken and retested as support. Also, confluence with the FIB retrace at the 38%.
I am waiting on a move north on the 60 minute chart to start building positions back to the high.
Gbpchflong

GBPCHF Potential Falling Wedge Continuation Pattern (long)H4 Timeframe
Potential falling wedge continuation pattern
waiting for price to break top trend line before going LONG

GBPCHF Potential Falling Wedge Continuation Pattern (long)H4 Timeframe
GBPCHF potential falling wedge continuation pattern
waiting for price to break top trend line before going LONG

GBPCHF..Strong indication to long100% technical...
This pair was flat for awhile on H4..time to scale in for long positions.

GBP/CHF Bullish OpportunityCurrent market of GBP/CHF moves slightly downwards between 1.35800 & 1.35100. It's good Time to Buy this price until 1.36200 as per downward channel analysis.

GBPCHF LONGHorizontal lines are important historical prices.
we se exhaustion wicks the last few days, hit support so now should be going up. Might bounce on the first horizontal line, only to bounce again on the support, to finally be headed towards the TP indication.
I think it might continue to the next horizontal line or even the resistance line, but the TP indication seems to be a real zone of interest for the price, so might go down again even to the resistance line again. so thats why the TP zone is until there and not further

GBP/CHF Bullish OpportunityGBP/CHF tring to create short term bearish channel. Now it's time to bullish until 1.37481.


GBPCHF ELLIOT WAVE AND LONG RETRACEMENT TOWARD DAILY 61% LEVELGBPCHF is coming off of an Elliot Wave and consolidating with slow upward trend toward the 61% level just passing the 50% level. Long term 23% levels will be attained on the monthly chart within the next year or two. Buy market execution on the GBPCHF.

GBP/CHF - Will the GBP Rampage continue? Ichimoku thinks so....This Swiss Franc has been dealing with some economic weakness lately, and the Pound has been on a bit of a rampage.I am looking for a buy into into a trend continuation with this pair. I want to keep a tight stop loss so I'll be setting it just below kijuns sen which has been respected this entire bullish run. I'm going to target just beyond our previous high for my first TP level. If we hit it, I will close partial position, and let the rest run, adjusting my stop loss periodically. If our bullish signs change, this setup may become invalidated.

GBPCHF - Longterm BearishGot a parallel set of trend lines that reveal a zone where the pair is screaming for a longterm Bearish trend

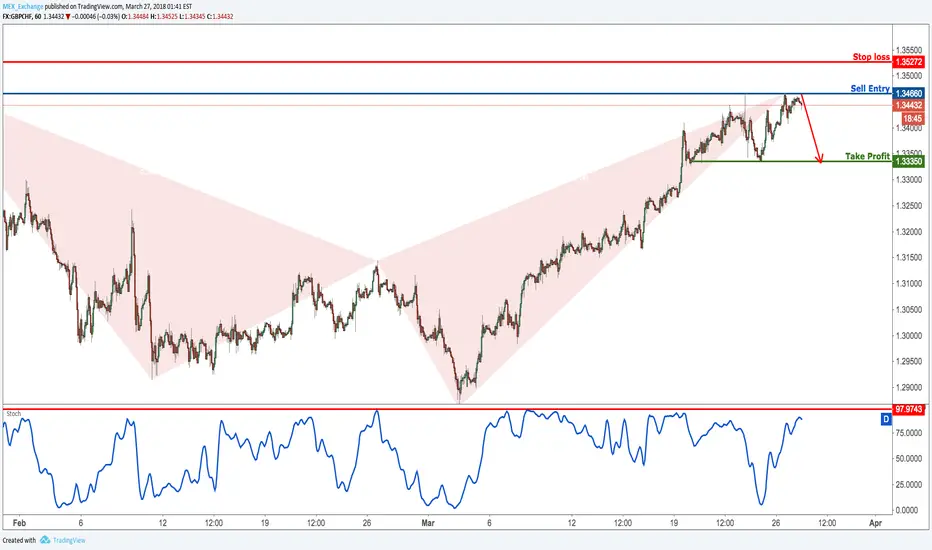
GBPCHF Testing Major Resistance, Time To SellGBPCHF is testing strong resistance presenting us with a good selling opportunity.
Sell below 1.3466. Stop loss at 1.3527. Take profit at 1.3335.
Reason for the trading strategy (technically):
Price is testing major resistance at 1.3466 (Fibonacci retracement, horizontal swing high resistance, bearish harmonic formation) and a strong reaction could occur from this level to push prices down to major support at 1.3335 (Fibonacci retracement, horizontal swing low support).
Stochastic (34,5,3) is seeing major resistance below 97% and a corresponding reaction could occur from this level.
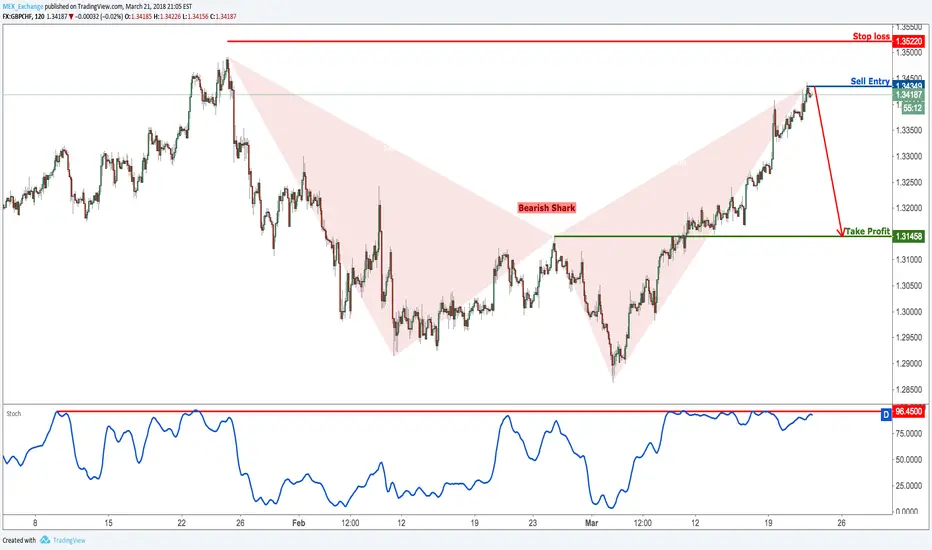
GBPCHF Is Testing Major Resistance, Time To SellGBPCHF is presenting us with a really good selling opportunity.
Sell below 1.3434. Stop loss at 1.3522. Take profit at 1.3145.
Reason for the trading strategy (technically):
Price is testing major resistance at 1.3434 (Fibonacci extension, bearish harmonic formation) and a strong drop could occur from here to push prices all the way down to 1.3145 (Fibonacci retracement, horizontal pullback support). We have our stop loss at 1.3522 (Fibonacci extension, above major swing high resistance) to give our trade some breathing space.
Stochastic (89,5,3) is seeing major resistance below 96% and a corresponding reaction could occur at this level.
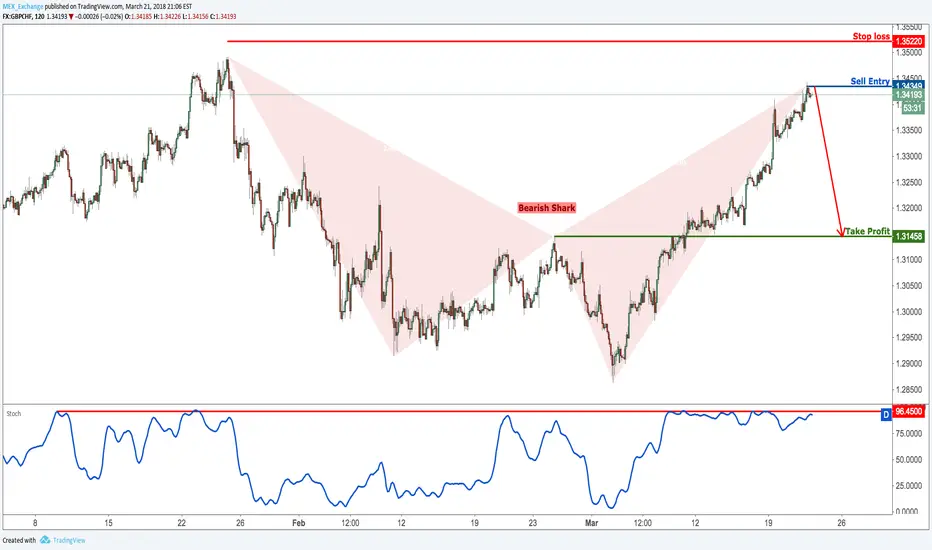