GBP/CHF SELL from market 1.11.25All the signs are that this pair is headed south.
On H1 we are now under all key EMA's (25,50,100,200) and on H4 we are slipping unde the 50 EMA having broken the 25.
The Pivot Point SuperTrend is signalling SELL and the Andean Oscillator has the red SELL line heading north (for a sell signal) as it has been for the last 2 days.
My STOP for this trade is ultra tight being set at 1.1138 so its a minimal 14 pips.
Target initially is WS2 Weekly Pivot but this will only be reashed if the WS1 pivot breaks which we will not know about until it reaches that level (1.1102) if indeed it does.
MACD has confirmed the BEARISH bias and the only concern is RSI which is now readin oversold at 29 on H1.
No scheduled news now to get in the way of this trade until 13:30 GMT Thursday so this pair will head to where the traders are pushing it and for now at least this looks like south.
Gbpchfsell

GBPCHF - Upside move ✅Hello traders!
‼️ This is my perspective on GBPCHF.
Technical analysis: Here we are in a bullish market structure from 4H timeframe perspective, so I am looking for a long. I expect bullish price action as price filled the imbalance and rejected from support zone.
Like, comment and subscribe to be in touch with my content!

GBPCHF 1H TF Divergence & Short Sentiment >90%GBPCHF price action is at critical breakout of previous HL. It shows 1H divergence with strong bearish sentiment of >90%. Will it break and go down? What do you think?
Trade Plan (Bearish Bias)
SL: Previous High
Entry: Sell Stop below three pips previous HL
TP: 1:1 risk and reward

GBPCHF Long Term SELLING Trading IdeaHello Traders
In This Chart GBPCHF DAILY Forex Forecast By FOREX PLANET
today GBPCHF analysis 👆
🟢This Chart includes_ (GBPCHF market update)
🟢What is The Next Opportunity on GBPCHF Market
🟢how to Enter to the Valid Entry With Assurance Profit
This CHART is For Trader's that Want to Improve Their Technical Analysis Skills and Their Trading By Understanding How To Analyze The Market Using Multiple Timeframes and Understanding The Bigger Picture on the Charts


GBPCHF - Short from bearish order block ✅Hello traders!
‼️ This is my perspective on GBPCHF.
Technical analysis: Here we are in a bearish market structure from 4H. timeframe perspective, so I am looking for short. I wait price to go a little bit higher to fill the imbalance, then to reject from bearish order block.
Like, comment and subscribe to be in touch with my content!


GBPCHF - Short from bearish order block ✅Hello traders!
‼️ This is my perspective on GBPCHF.
Technical analysis: Here we are in a bearish market structure from 4H. timeframe perspective, so I am looking for short. I expect price to continue the retracement to fill the imbalance higher and then to reject from bearish order block.
Like, comment and subscribe to be in touch with my content!

GBPCHF - AMD Pattern ✅Hello traders!
‼️ This is my perspective on GBPCHF.
Technical analysis: As we can see here price is in a range for the last 3 weeks it means accumulation phase, I expect price to manipulate buy side liquidity and then to distribute lower.
Like, comment and subscribe to be in touch with my content!

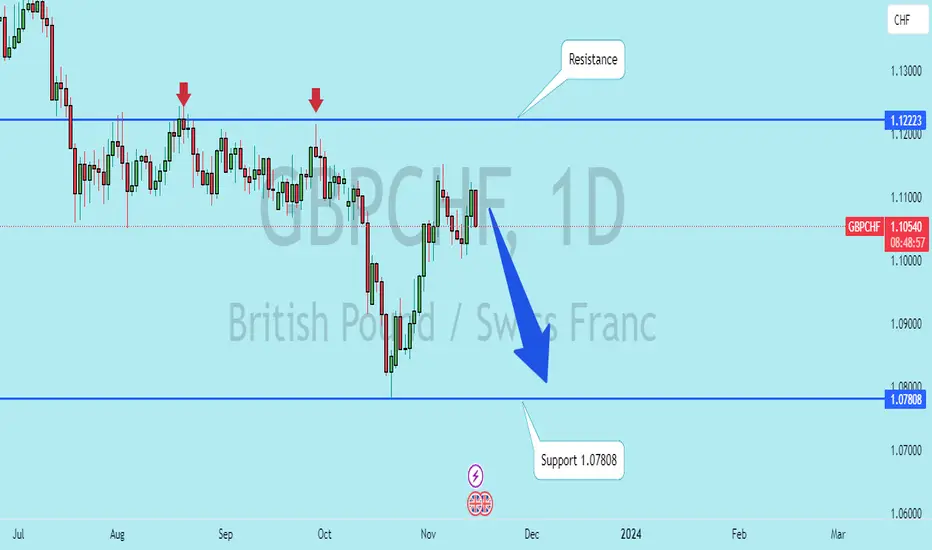
GBPCHFThe GBP/CHF pair is currently in a downtrend, evident from the preceding red 1-week candle. However, on the 1-day timeframe, the pair is showing an upward trend. As the price approaches the upper band of the Bollinger Bands (BB) indicator, indicating overbought conditions, our strategy is to sell, considering the upper BB line as resistance. The target for this sell position is the 1.077 area.
GBPCHF Trade IdeaGBPCHF Trade Idea
Each zone acts as support (we buy upon confirmation) if the market is above the zone & each zone acts as a resistance (we sell upon confirmation) if the market is below zone.

GBPCHF: 09/11/2023:🔴sell opportunity🔴You can see all the important zones and levels on the chart.
We expect the price to test the bearish order block and then fall.
we need LTF confirmation for entry.
💡Wait for the update!
🗓09/11/2023
🔎 DYOR
💌It is my honor to share your comments with me💌


GBPCHF Long Term SELLING Trading IdeaHello Traders
In This Chart GBPCHF DAILY Forex Forecast By FOREX PLANET
today GBPCHF analysis 👆
🟢This Chart includes_ (GBPCHF market update)
🟢What is The Next Opportunity on GBPCHF Market
🟢how to Enter to the Valid Entry With Assurance Profit
This CHART is For Trader's that Want to Improve Their Technical Analysis Skills and Their Trading By Understanding How To Analyze The Market Using Multiple Timeframes and Understanding The Bigger Picture on the Charts

GBPCHF : Short Trade , 4hHello traders, we want to check the GBPCHF chart. The price is moving in a descending channel and has pulled back to a key level that the price has reacted to several times in the past. We expect this level to play the role of a resistance level and maintain the downward trend of the price. We expect the price to fall to around 1.08000. Good luck.

False Breakout or Break Down Towards 1.06 ?I find this pair interesting, and there is a bias for both a long and a short trade, which I'll explain in this post.
Let's start with the short trade idea. Last Friday, there was a significant move as the price broke below the 1.105 support level, which had held since August last year. The price dropped to the next support at 1.09 and has since bounced back towards the 1.105 previous support and should now act as resistance.
To confirm the breakout, we need the 1.105 level to act as resistance. So, for the short trade, I'm looking for the price to come back to this level and show resistance on shorter timeframes, similar to the image below:
If we see this type of price action, I'll use my TRFX indicator to find selling opportunities on shorter timeframes. If this happens, there's a good chance of a downward move towards the BUY/DEMAND area starting at 1.06, which could attract long-term buyers and be a good place to start a long trade, this is where I will be looking to go long.
To invalidate the short trade, we'd need confirmation that the breakout was false, along with a strong weekly close above the 1.105 level.

GBPCHF - Potential short ✅Hello traders!
‼️ This is my perspective on GBPCHF.
Technical analysis: Here we have strong bearish price action, so I think we can see bearish market structure. I want price to make a retracement to fill the imbalances and then to reject from bearish order block.
Like, comment and subscribe to be in touch with my content!

GBPCHF I Descending Triangle Welcome back! Let me know your thoughts in the comments!
** GBPCHF Analysis - Listen to video!
We recommend that you keep this pair on your watchlist and enter when the entry criteria of your strategy is met.
Please support this idea with a LIKE and COMMENT if you find it useful and Click "Follow" on our profile if you'd like these trade ideas delivered straight to your email in the future.
Thanks for your continued support!

GBPCHF Prediction H1Here is my analysis for GBPCHF on H1 using Order Block. The price could go bearish, you can put a pending order on the Order block or find an entry on LTF within OB Zone. Trade Safe!

GBPCHF Long Term SELLING Trading IdeaHello Traders
In This Chart GBPCHF DAILY Forex Forecast By FOREX PLANET
today GBPCHF analysis 👆
🟢This Chart includes_ (GBPCHF market update)
🟢What is The Next Opportunity on GBPCHF Market
🟢how to Enter to the Valid Entry With Assurance Profit
This CHART is For Trader's that Want to Improve Their Technical Analysis Skills and Their Trading By Understanding How To Analyze The Market Using Multiple Timeframes and Understanding The Bigger Picture on the Charts

GBPCHF SHORThello traders.we have ICT setup in 1hr.price is going to fall after take the liquidity and also touching FVG and orderblock area.so in smaller time frame after confirmation we open short position.
R:R 1.5
good luck
“”your follows and boosts encourage me to publish more analysis””

GBPCHF Will Keep Falling!GBP-CHF is trading in a
Downtrend and the pair
Has formed a bearish flag
Pattern so now that we are
Seeing a bearish breakout
I think that the price
Will go further down!

The truth of Market TrendGBPCHF BUY AND SELL LONG analaysis. as we can see market structure starting downtrend on DAILY, but breakout SELL on H4, so the next movement that i predict the price will retrace zone (1.1312 - 1.1205) before back to the top (1.4511-1.14843) and start major downtrend till price hit 1.109525
