GBP/JPY BEST PLACE TO SELL FROM|SHORT
Hello, Friends!
We are going short on the GBP/JPY with the target of 192.600 level, because the pair is overbought and will soon hit the resistance line above. We deduced the overbought condition from the price being near to the upper BB band. However, we should use low risk here because the 1W TF is green and gives us a counter-signal.
Disclosure: I am part of Trade Nation's Influencer program and receive a monthly fee for using their TradingView charts in my analysis.
✅LIKE AND COMMENT MY IDEAS✅
GBPJPY

GBPJPY Hello traders,
I'd like to share the first trade of the day with you. The setup is a Buy trade on the GBPJPY pair.
Today is the last trading day of the week and we have major economic events on the calendar, including:
🔹 Average Hourly Earnings (MoM)
🔹 Non-Farm Payrolls (NFP)
🔹 Unemployment Rate
So it's wise to remain cautious while executing trades today.
🔍 Trade Details
✔️ Timeframe: 15-Minute
✔️ Risk-to-Reward Ratio: 1:1(me) /1:1.50
✔️ Trade Direction: Buy
✔️ Entry Price: 195.054
✔️ Take Profit: 195.403
✔️ Stop Loss: 194.985
🔔 Disclaimer: This is not financial advice. I’m simply sharing a trade I’ve taken based on my personal trading system, strictly for educational and illustrative purposes.
📌 Interested in a systematic, data-driven trading approach?
💡 Follow the page and turn on notifications to stay updated on future trade setups and advanced market insights.

gbpnzd sellprice is in a 1hr supply at the moment and trend is bearish on 1hr 4hr tf. price is visiting the 1hr zone for the first time on 15m tf. it will form a double top if it closes fueling sell momentum. since its been in a steady uptrend it may look to retrace if it wants to go up. im looking to enter once price trade below the leg of the swing entering the 1hr zone.

Usdcad Sellprice is bearish still on the 4hr tf and is in a 4hr supply zone. there are supplies across the lower tfs within the 4hr zone. there is a particular one on the 15m tf that is strong. looking to sell once price trades below last ll.

Eurchf BuyEurchf is in a bullish trend on the 4hr tf and is currently trading around a 4 hr demand that was made some days ago. once price closes above the green line which is a supply on the 1hr its should suggest buyers are still interested. if so there is a 5m supply that i need price to break which is my entry point targeting 4hr supply above

Gold Hits All Targets with 500+ Pips – Eyes Now on $3420By examining the gold chart on the 4-hour timeframe, we can see that after our previous analysis, the price moved exactly as expected and successfully hit all four targets — $3367, $3380, $3391, and $3400 — reaching as high as $3403 and delivering over 500 pips of return.
After sweeping the liquidity above $3400, the price corrected back to around $3370. Currently, gold is trading around $3380. If the price can hold above the $3370 level, we can expect a continuation of the bullish move toward the $3420 area.
Please support me with your likes and comments to motivate me to share more analysis with you and share your opinion about the possible trend of this chart with me !
Best Regards , Arman Shaban

Audusd Longprice is in bullish trend on the 4hr timeframe. price was consolidating around a 1hr poi and demand zone/ it recently broke through a 4hr key level and reached a 4hr poi. im expecting a minor pullback before continuing to the upside

Trading balanceTrading balance The price of the asset has rebounded from the balance zone. With the prospect of growth into the resistance zone.

GBPJPY Will Go Up! Buy!
Take a look at our analysis for GBPJPY.
Time Frame: 9h
Current Trend: Bullish
Sentiment: Oversold (based on 7-period RSI)
Forecast: Bullish
The market is on a crucial zone of demand 194.411.
The oversold market condition in a combination with key structure gives us a relatively strong bullish signal with goal 196.230 level.
P.S
Please, note that an oversold/overbought condition can last for a long time, and therefore being oversold/overbought doesn't mean a price rally will come soon, or at all.
Disclosure: I am part of Trade Nation's Influencer program and receive a monthly fee for using their TradingView charts in my analysis.
Like and subscribe and comment my ideas if you enjoy them!

Bullish bounce?GBP/JPY is falling towards the pivot, which had been identified as a pullback support and could bounce to the 61.8% Fibonacci resistance.
Pivot: 193.10
1st Support: 192.25
1st Resistance: 194.38
Risk Warning:
Trading Forex and CFDs carries a high level of risk to your capital and you should only trade with money you can afford to lose. Trading Forex and CFDs may not be suitable for all investors, so please ensure that you fully understand the risks involved and seek independent advice if necessary.
Disclaimer:
The above opinions given constitute general market commentary, and do not constitute the opinion or advice of IC Markets or any form of personal or investment advice.
Any opinions, news, research, analyses, prices, other information, or links to third-party sites contained on this website are provided on an "as-is" basis, are intended only to be informative, is not an advice nor a recommendation, nor research, or a record of our trading prices, or an offer of, or solicitation for a transaction in any financial instrument and thus should not be treated as such. The information provided does not involve any specific investment objectives, financial situation and needs of any specific person who may receive it. Please be aware, that past performance is not a reliable indicator of future performance and/or results. Past Performance or Forward-looking scenarios based upon the reasonable beliefs of the third-party provider are not a guarantee of future performance. Actual results may differ materially from those anticipated in forward-looking or past performance statements. IC Markets makes no representation or warranty and assumes no liability as to the accuracy or completeness of the information provided, nor any loss arising from any investment based on a recommendation, forecast or any information supplied by any third-party.

GBPJPY OUTLOOKWe saw price took a shift which validated a bull structure while gathering up liquidity. Now price is currently moving sideways which shows buyers are lagging. I see sellers coming in here once support gets broken. I will be hoping in for a sell after the breakout at the nearest order block.

Bullish bounce?GBP/JPY is falling towards the support level which is a pullback support that is slightly above the 100% Fibonacci projection and could bounce from this level to our take profit.
Entry: 191.97
Why we like it:
There is a pullback support level that is slightly above the 100% Fibonacci projection.
Stop loss: 190.39
Why we like it:
There is a pullback support level that lines up with the 138.2% Fibonacci extension.
Take profit: 196.27
Why we like it:
There is a pullback resistance level.
Enjoying your TradingView experience? Review us!
Please be advised that the information presented on TradingView is provided to Vantage (‘Vantage Global Limited’, ‘we’) by a third-party provider (‘Everest Fortune Group’). Please be reminded that you are solely responsible for the trading decisions on your account. There is a very high degree of risk involved in trading. Any information and/or content is intended entirely for research, educational and informational purposes only and does not constitute investment or consultation advice or investment strategy. The information is not tailored to the investment needs of any specific person and therefore does not involve a consideration of any of the investment objectives, financial situation or needs of any viewer that may receive it. Kindly also note that past performance is not a reliable indicator of future results. Actual results may differ materially from those anticipated in forward-looking or past performance statements. We assume no liability as to the accuracy or completeness of any of the information and/or content provided herein and the Company cannot be held responsible for any omission, mistake nor for any loss or damage including without limitation to any loss of profit which may arise from reliance on any information supplied by Everest Fortune Group.

GBPJPY - Short Term Sell Trade Update!!!Hi Traders, on May 14th I shared this idea "GBPJPY - Looking To Sell Pullbacks In The Short Term"
I expected to see pullbacks and further continuation lower until the strong resistance zone holds. You can read the full post using the link above.
Pullback and push lower happened as per the plan!!!
If you enjoy this idea, don’t forget to LIKE 👍, FOLLOW ✅, SHARE 🙌, and COMMENT ✍! Drop your thoughts and charts below to keep the discussion going. Your support helps keep this content free and reach more people! 🚀
-------------------------------------------------------------------------------------------------------------------
Disclosure: I am part of Trade Nation's Influencer program and receive a monthly fee for using their TradingView charts in my analysis.

GBPJPY H4 | Bearish Fall Based on the H4 chart, the price has just reacted off our sell entry level at 194.99, a pullback resistance that aligns with the 61.8% Fib retracement.
Our take profit is set at 193.38 a pullback support.
The stop loss is set at 196.42, a swing high resistance.
High Risk Investment Warning
Trading Forex/CFDs on margin carries a high level of risk and may not be suitable for all investors. Leverage can work against you.
Stratos Markets Limited (tradu.com ):
CFDs are complex instruments and come with a high risk of losing money rapidly due to leverage. 63% of retail investor accounts lose money when trading CFDs with this provider. You should consider whether you understand how CFDs work and whether you can afford to take the high risk of losing your money.
Stratos Europe Ltd (tradu.com ):
CFDs are complex instruments and come with a high risk of losing money rapidly due to leverage. 63% of retail investor accounts lose money when trading CFDs with this provider. You should consider whether you understand how CFDs work and whether you can afford to take the high risk of losing your money.
Stratos Global LLC (tradu.com ):
Losses can exceed deposits.
Please be advised that the information presented on TradingView is provided to Tradu (‘Company’, ‘we’) by a third-party provider (‘TFA Global Pte Ltd’). Please be reminded that you are solely responsible for the trading decisions on your account. There is a very high degree of risk involved in trading. Any information and/or content is intended entirely for research, educational and informational purposes only and does not constitute investment or consultation advice or investment strategy. The information is not tailored to the investment needs of any specific person and therefore does not involve a consideration of any of the investment objectives, financial situation or needs of any viewer that may receive it. Kindly also note that past performance is not a reliable indicator of future results. Actual results may differ materially from those anticipated in forward-looking or past performance statements. We assume no liability as to the accuracy or completeness of any of the information and/or content provided herein and the Company cannot be held responsible for any omission, mistake nor for any loss or damage including without limitation to any loss of profit which may arise from reliance on any information supplied by TFA Global Pte Ltd.
The speaker(s) is neither an employee, agent nor representative of Tradu and is therefore acting independently. The opinions given are their own, constitute general market commentary, and do not constitute the opinion or advice of Tradu or any form of personal or investment advice. Tradu neither endorses nor guarantees offerings of third-party speakers, nor is Tradu responsible for the content, veracity or opinions of third-party speakers, presenters or participants.

gbpjpy sell signal. Don't forget about stop-loss.
Write in the comments all your questions and instruments analysis of which you want to see.
Friends, push the like button, write a comment, and share with your mates - that would be the best THANK YOU.
P.S. I personally will open entry if the price will show it according to my strategy.
Always make your analysis before a trade

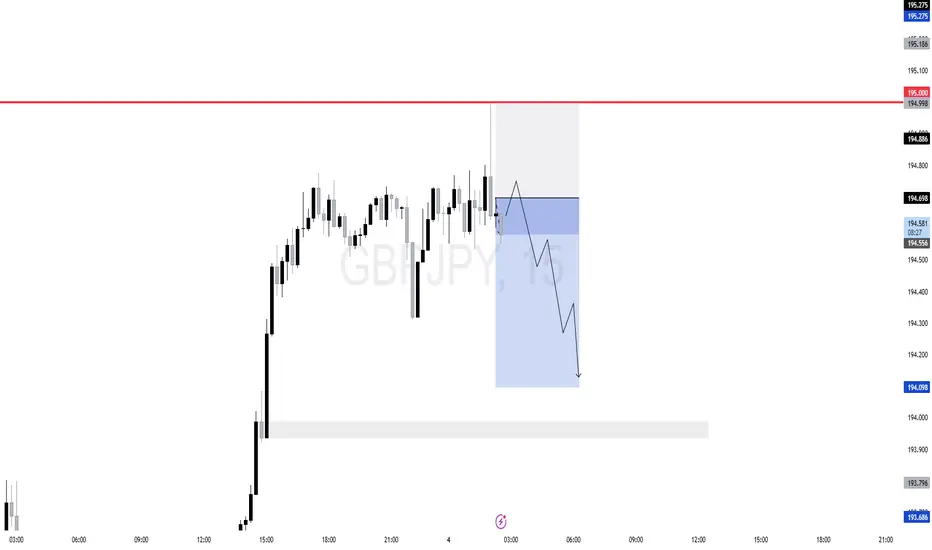
GBPJPY 15-min chart setup✅ What I Like:
Liquidity Sweep at 195.000: Price ran buy-side liquidity above a clear psychological level and showed signs of rejection — classic manipulation.
FVG + Premium Retracement: The short setup aligns with an entry around the 0.618–0.75 retracement zone of the recent leg up, which is also inside a fair value gap.
Timing
🔻 Concerns:
Momentum: The bullish impulse leading to 195.000 was strong. If no displacement confirms the move down, price may consolidate or go higher.
No Strong Break of Structure Yet: To validate full bearish intent, I'd prefer to see a solid break below a recent short-term low (market structure shift).
Potential bullish rise?GBP/JPY has reacted off the pivot and could rise to the 145% Fibonacci resistance.
Pivot: 194.43
1st Support: 193.80
1st Resistance: 195.61
Risk Warning:
Trading Forex and CFDs carries a high level of risk to your capital and you should only trade with money you can afford to lose. Trading Forex and CFDs may not be suitable for all investors, so please ensure that you fully understand the risks involved and seek independent advice if necessary.
Disclaimer:
The above opinions given constitute general market commentary, and do not constitute the opinion or advice of IC Markets or any form of personal or investment advice.
Any opinions, news, research, analyses, prices, other information, or links to third-party sites contained on this website are provided on an "as-is" basis, are intended only to be informative, is not an advice nor a recommendation, nor research, or a record of our trading prices, or an offer of, or solicitation for a transaction in any financial instrument and thus should not be treated as such. The information provided does not involve any specific investment objectives, financial situation and needs of any specific person who may receive it. Please be aware, that past performance is not a reliable indicator of future performance and/or results. Past Performance or Forward-looking scenarios based upon the reasonable beliefs of the third-party provider are not a guarantee of future performance. Actual results may differ materially from those anticipated in forward-looking or past performance statements. IC Markets makes no representation or warranty and assumes no liability as to the accuracy or completeness of the information provided, nor any loss arising from any investment based on a recommendation, forecast or any information supplied by any third-party.

GBPJPY What Next? BUY!
My dear subscribers,
This is my opinion on the GBPJPY next move:
The instrument tests an important psychological level 193.34
Bias - Bullish
Technical Indicators: Supper Trend gives a precise Bullish signal, while Pivot Point HL predicts price changes and potential reversals in the market.
Target - 194.37
About Used Indicators:
On the subsequent day, trading above the pivot point is thought to indicate ongoing bullish sentiment, while trading below the pivot point indicates bearish sentiment.
Disclosure: I am part of Trade Nation's Influencer program and receive a monthly fee for using their TradingView charts in my analysis.
———————————
WISH YOU ALL LUCK

LONG ON GBP/JPYGJ has given us a double bottom at a major demand level.
I am looking to catch over 100 pips on GJ to the previous high.


GBPJPYGBPJPY price has a chance to test the support zone 192.349-192.002. If the price cannot break through the 192.002 level, it is expected that in the short term, there is a chance that the price will rebound. Consider buying the red zone.
🔥Trading futures, forex, CFDs and stocks carries a risk of loss.
Please consider carefully whether such trading is suitable for you.
>>GooD Luck 😊
❤️ Like and subscribe to never miss a new idea!

GBPJPY LONG FORECAST Q2 W23 D3 Y25GBPJPY LONG FORECAST Q2 W23 D3 Y25
Professional Risk Managers👋
Welcome back to another FRGNT chart update📈
Diving into some Forex setups using predominantly higher time frame order blocks alongside confirmation breaks of structure.
Let’s see what price action is telling us today!
💡Here are some trade confluences📝
✅Daily order block
✅15' order block
✅Intraday breaks of structure
✅4H 50 EMA rejection
🔑 Remember, to participate in trading comes always with a degree of risk, therefore as professional risk managers it remains vital that we stick to our risk management plan as well as our trading strategies.
📈The rest, we leave to the balance of probabilities.
💡Fail to plan. Plan to fail.
🏆It has always been that simple.
❤️Good luck with your trading journey, I shall see you at the very top.
🎯Trade consistent, FRGNT X

GBPJPY Potential UpsidesHey Traders, in the coming week we are monitoring GBPJPY for a buying opportunity around 193.300 zone, GBPJPY is trading in an uptrend and currently is in a correction phase in which it is approaching the trend at 193.300 support and resistance area.
Trade safe, Joe.
