GBPJPY IdeaWe are waiting for our asset to reach our action zone, and based on the reaction, we’ll decide on our next moves.ALWAYS WAIT FOR A CONFIRMATION TO SEE IF THE PRICE VALIDATES THE ZONE.and you what is your vision of the EURUSD its interests me! i wait you in the commentary
GBPJPY

XAU/USD | Gold Holding Strong – Watching for Next Bullish Move!By analyzing the gold chart on the 4-hour timeframe, we can see that yesterday, as expected, when the price dropped to around $3357, it faced strong buying pressure and rallied up to $3377. After that, it corrected again, pulling back to $3338 so far, and is currently trading around $3341. If gold manages to hold above $3337, we can expect another bullish move, with potential targets at $3347, $3354, $3364, and $3374.
Please support me with your likes and comments to motivate me to share more analysis with you and share your opinion about the possible trend of this chart with me !
Best Regards , Arman Shaban

GBPJPY Potential UpsidesHey Traders, in the coming week we are monitoring GBPJPY for a buying opportunity around 197.900 zone, GBPJPY is trading in an uptrend and currently is in a correction phase in which it is approaching the trend at 197.900 support and resistance area.
Trade safe, Joe.

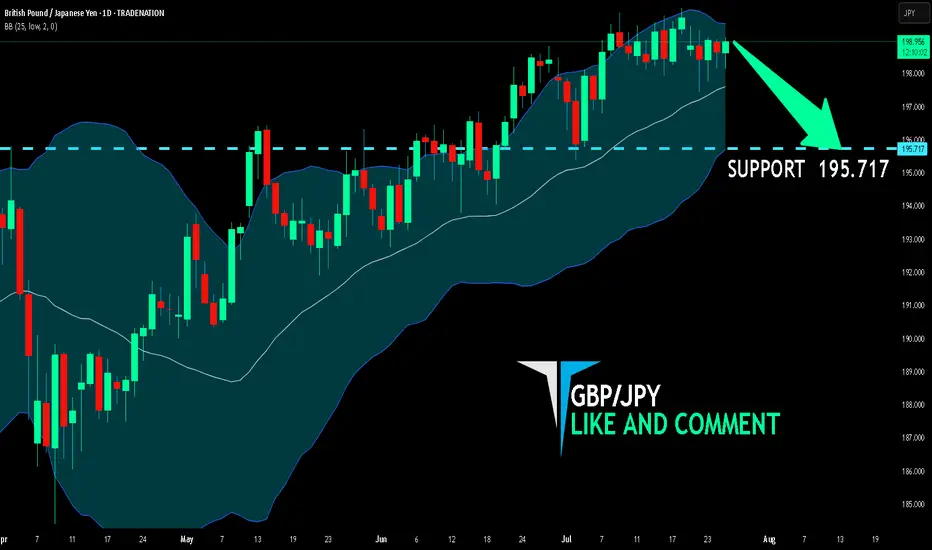
GBP/JPY BEARISH BIAS RIGHT NOW| SHORT
Hello, Friends!
GBP/JPY pair is trading in a local uptrend which we know by looking at the previous 1W candle which is green. On the 1D timeframe the pair is going up too. The pair is overbought because the price is close to the upper band of the BB indicator. So we are looking to sell the pair with the upper BB line acting as resistance. The next target is 195.717 area.
Disclosure: I am part of Trade Nation's Influencer program and receive a monthly fee for using their TradingView charts in my analysis.
✅LIKE AND COMMENT MY IDEAS✅
GBPJPY uptrend co0ntinuation support at 196.75Key Support: 196.75
This level marks the prior consolidation zone and serves as a critical pivot. A corrective pullback toward 196.75 followed by a bullish reversal would validate the uptrend, with upside targets at:
199.20 – Initial resistance and short-term target
199.70 – Minor resistance zone
200.40 – Longer-term breakout objective
However, a daily close below 196.75 would invalidate the bullish scenario, potentially triggering a deeper retracement toward:
195.80 – Near-term support
194.80 – Key downside level in a bearish reversal
Conclusion:
As long as 196.75 holds, the bias remains bullish, favoring continuation toward the 199–200 zone. A confirmed break below this support would shift momentum, opening the door for a broader corrective decline.
This communication is for informational purposes only and should not be viewed as any form of recommendation as to a particular course of action or as investment advice. It is not intended as an offer or solicitation for the purchase or sale of any financial instrument or as an official confirmation of any transaction. Opinions, estimates and assumptions expressed herein are made as of the date of this communication and are subject to change without notice. This communication has been prepared based upon information, including market prices, data and other information, believed to be reliable; however, Trade Nation does not warrant its completeness or accuracy. All market prices and market data contained in or attached to this communication are indicative and subject to change without notice.

GBPJPY Potential UpsidesHey Traders, in today's trading session we are monitoring GBPJPY for a buying opportunity around 197.700 zone, GBPJPY is trading in an uptrend and currently is in a correction phase in which it is approaching the trend at 197.700 support and resistance area.
Trade safe, Joe.

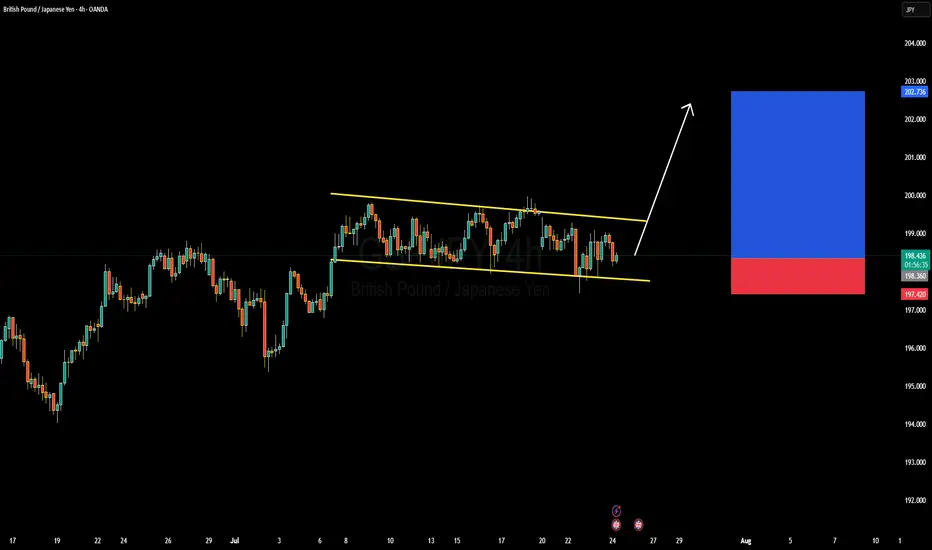
GBPJPY Forming Descending ChannelGBPJPY is currently trading within a well-defined descending channel on the 4H chart, showing signs of building pressure toward an upside breakout. The price has consistently respected both the upper and lower bounds of this channel, creating a controlled correction within a larger bullish trend. With the recent bounce off the lower channel boundary, the pair is now preparing for a potential bullish breakout, aiming for a target zone near 202.700 in the coming sessions.
From a fundamental perspective, the British pound is benefiting from hawkish commentary by the Bank of England, which continues to battle sticky inflation. The latest UK inflation data suggests that price pressures remain elevated, prompting market participants to anticipate further tightening or a prolonged hold in interest rates. On the other hand, the Japanese yen continues to weaken due to the Bank of Japan’s ultra-loose monetary policy, making GBPJPY attractive for long positions amid widening yield differentials.
Technically, the structure remains bullish in the broader context, and this descending channel looks more like a bullish flag—a continuation pattern. If bulls maintain momentum and break above the upper trendline near 199.50, we can expect a strong impulsive move toward the 202–203 zone. The risk remains well-defined below 197.40, which is the recent swing low, giving a healthy risk-to-reward setup for traders.
With strong technical structure and fundamental divergence favoring the British pound over the yen, GBPJPY presents a high-probability long opportunity. I'm looking for confirmation of a breakout on lower timeframes, and once triggered, I expect clean bullish follow-through. Stay ready for the breakout—it’s a textbook setup aligning with macro and technical confluence.
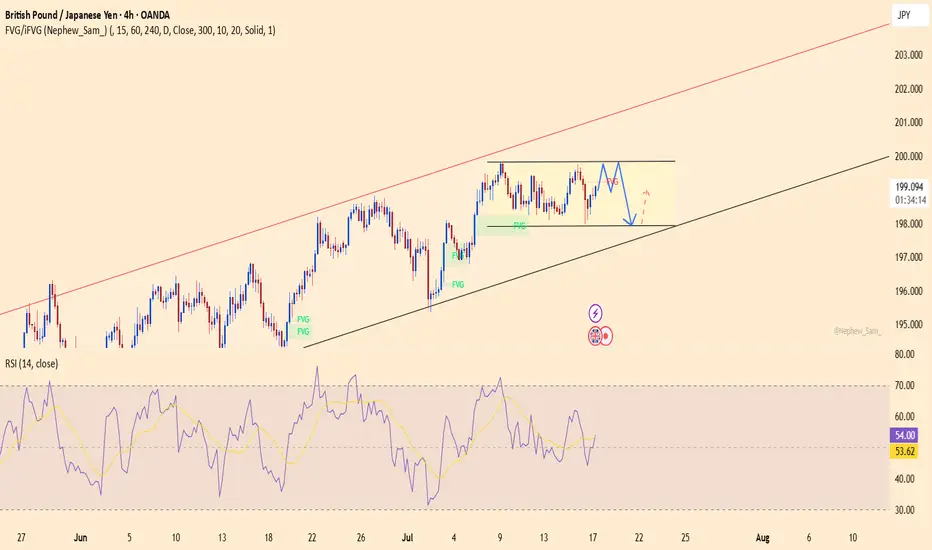
GBPJPY – is the end of the range near?After nearly two weeks stuck in the 197.600–200.000 range, GBPJPY has successfully shaken off a bearish fakeout and is now consolidating near the upper FVG zone. The bullish structure remains intact within the rising channel – and this time, the market may not forgive another missed opportunity.
Supporting news:
– UK CPI data released yesterday came in hotter than expected → inflation pressure is back → market expects the BoE to stay hawkish → GBP gains strength.
– Meanwhile, the JPY continues to weaken as the BoJ maintains ultra-low interest rates, setting the stage for this pair to surge.
A breakout above 200.000 could open the door for a push toward the channel top – this could be the ignition point for a major summer rally.

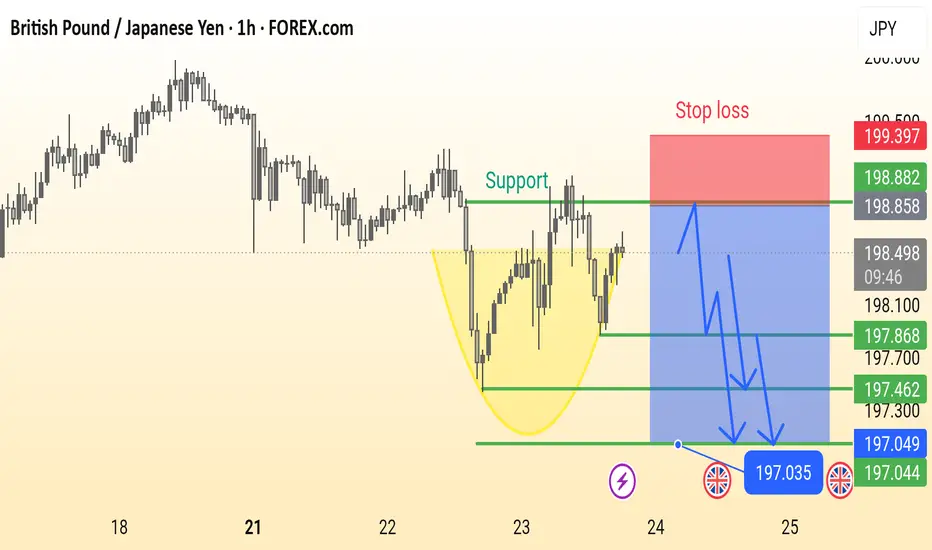
GBP/JPY Analysis is Ready This is a 1-hour chart of the GBP/JPY currency pair showing a potential bearish setup. Key elements include:
Support Zone: Around 198.000, previously tested multiple times.
Bearish Cup Pattern: Highlighted in yellow, suggesting a reversal.
Stop Loss: Marked above 199.397.
Sell Entry Zone: Near the support break at ~198.000.
Bearish Targets: 197.868 → 197.462 → 197.035 (with final support near 197.044).
Bearish Projection Arrows: Indicate expected price movement after breakdown.
This chart suggests a sell setup on breakdown, with well-defined risk and reward levels.
EUR/USD | Bullish Momentum Builds – Next Targets Ahead! (READ)By analyzing the EURUSD chart on the 4-hour timeframe, we can see that, as per the previous analysis, the price first made a strong move in two steps, successfully hitting the 1.15580 target. Upon reaching this key level, it reacted positively with increased demand and is now trading around 1.16520. Given the current trend, I expect further bullish movement soon, with the next potential targets at 1.16720, 1.17230, and 1.17500.
Please support me with your likes and comments to motivate me to share more analysis with you and share your opinion about the possible trend of this chart with me !
Best Regards , Arman Shaban

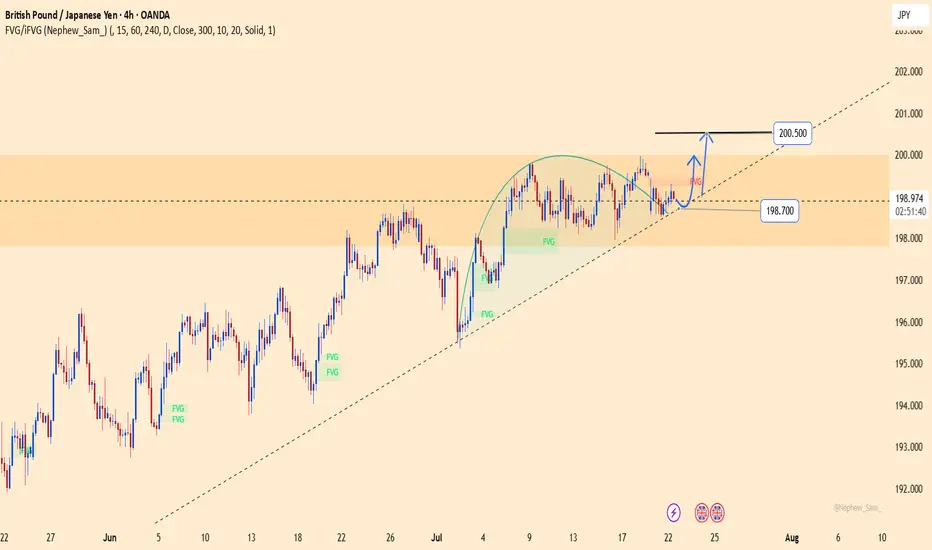
GBPJPY – breakout loading: final leap to 200.500?After days of compression, GBPJPY is flashing clear signs of an explosive breakout.
Price is holding firmly above the ascending trendline and consolidating right at the top of the FVG zone – a strong signal that buyers are preparing to punch through the 200.500 resistance in one decisive move.
Meanwhile, the JPY continues to lose ground as the BoJ shows no clear intention to hike rates, while GBP gains support on expectations that the BoE will maintain its hawkish stance longer due to persistent core inflation.
Trade setup (reference):
Buy limit: 198.900
SL: below 198.500
TP: 200.500
GBPJPY is in the Down Trend From Resistance LevelHello Traders
In This Chart GBPJPY HOURLY Forex Forecast By FOREX PLANET
today GBPJPY analysis 👆
🟢This Chart includes_ (GBPJPY market update)
🟢What is The Next Opportunity on GBPJPY Market
🟢how to Enter to the Valid Entry With Assurance Profit
This CHART is For Trader's that Want to Improve Their Technical Analysis Skills and Their Trading By Understanding How To Analyze The Market Using Multiple Timeframes and Understanding The Bigger Picture on the Charts

GBPJPY: Swing Trading & Technical Analysis
It is essential that we apply multitimeframe technical analysis and there is no better example of why that is the case than the current GBPJPY chart which, if analyzed properly, clearly points in the upward direction.
Disclosure: I am part of Trade Nation's Influencer program and receive a monthly fee for using their TradingView charts in my analysis.
❤️ Please, support our work with like & comment! ❤️

GBPJPY Is Bearish! Short!
Take a look at our analysis for GBPJPY.
Time Frame: 1D
Current Trend: Bearish
Sentiment: Overbought (based on 7-period RSI)
Forecast: Bearish
The price is testing a key resistance 198.794.
Taking into consideration the current market trend & overbought RSI, chances will be high to see a bearish movement to the downside at least to 192.854 level.
P.S
The term oversold refers to a condition where an asset has traded lower in price and has the potential for a price bounce.
Overbought refers to market scenarios where the instrument is traded considerably higher than its fair value. Overvaluation is caused by market sentiments when there is positive news.
Disclosure: I am part of Trade Nation's Influencer program and receive a monthly fee for using their TradingView charts in my analysis.
Like and subscribe and comment my ideas if you enjoy them!

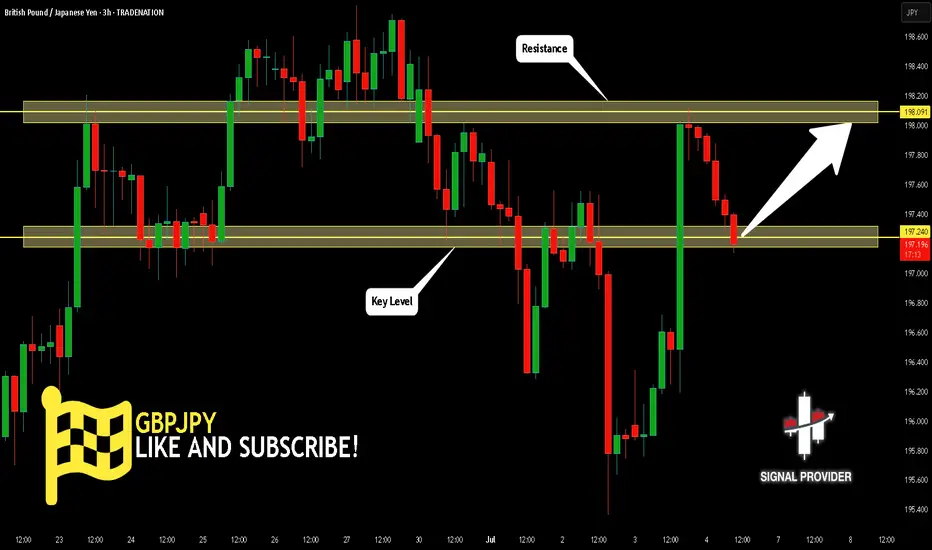
GBPJPY Will Go Up! Buy!
Please, check our technical outlook for GBPJPY.
Time Frame: 3h
Current Trend: Bullish
Sentiment: Oversold (based on 7-period RSI)
Forecast: Bullish
The market is approaching a key horizontal level 197.240.
Considering the today's price action, probabilities will be high to see a movement to 198.091.
P.S
Please, note that an oversold/overbought condition can last for a long time, and therefore being oversold/overbought doesn't mean a price rally will come soon, or at all.
Disclosure: I am part of Trade Nation's Influencer program and receive a monthly fee for using their TradingView charts in my analysis.
Like and subscribe and comment my ideas if you enjoy them!
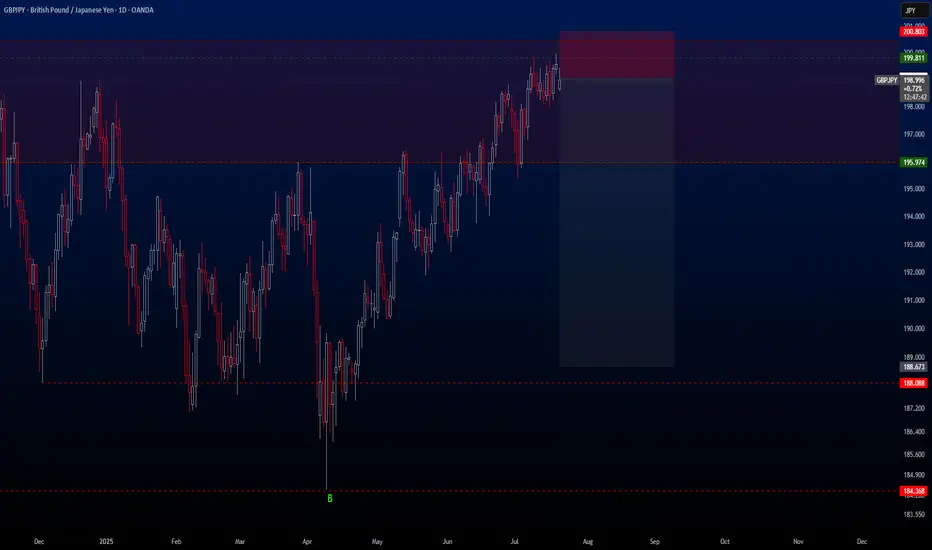
GBPJPYHello traders,
The holidays are over and we’re back to trading again! 🙂
Our first trade is on the **GBPJPY** pair. This setup is quite ideal for those thinking long-term. I’ve already activated this trade on my side.
🔍 **Trade Details**
✔️ **Timeframe**: D/W
✔️ **Risk-to-Reward Ratio**: 1:6
✔️ **Trade Direction**: Sell
✔️ **Entry Price**: 199.073
✔️ **Take Profit**: 188.673
✔️ **Stop Loss**: 200.803
🔔 **Disclaimer**: This is not financial advice. I’m simply sharing a trade I’ve taken based on my personal trading system, strictly for educational and illustrative purposes.
📌 Interested in a systematic, data-driven trading approach?
💡 Follow the page and turn on notifications to stay updated on future trade setups and advanced market insights.
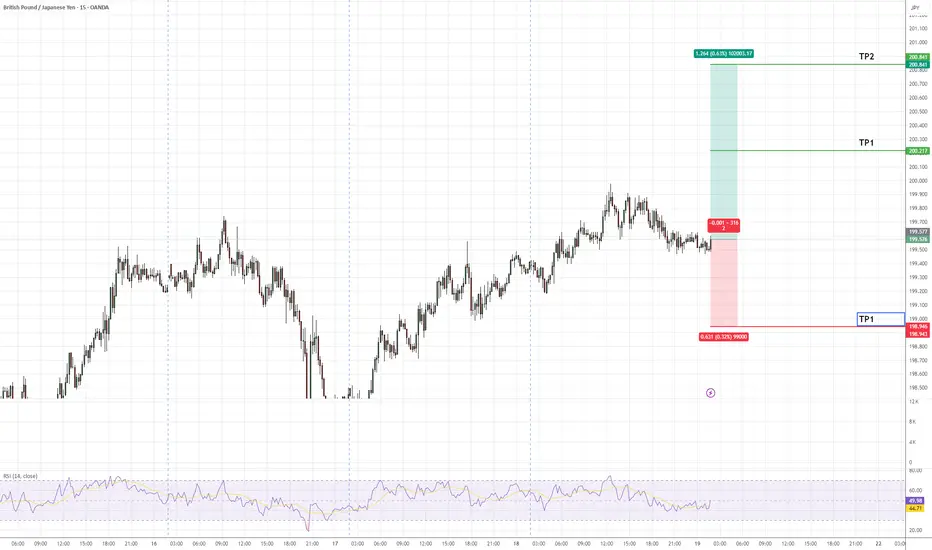
Potential Bullish Trade in GBPJPYGBPJPY continues to exhibit strong bullish momentum, with price action aligning with the prevailing uptrend. The pair is projected to advance towards the identified target zones (TP1 and TP2) as marked on the chart. A stop-loss level (SL) has been defined to manage downside risk effectively.
Traders are advised to monitor key support and resistance levels for potential confirmations as the setup develops.
GBPJPY set for breakoutGBPJPY is currently trading in a sideways pattern within an ascending channel. The support zone around 197.900 has been respected multiple times, while price repeatedly fails to break above the 199.800 resistance – signaling that built-up pressure may soon erupt.
Recent data shows that UK inflation remains high, and the Bank of England may maintain its hawkish stance, supporting the GBP. Meanwhile, global risk-off sentiment continues to weaken the JPY.
If price breaks through the current resistance, it would confirm the continuation of the uptrend, with a target toward the upper boundary of the red channel. However, if rejection persists, buying from support remains a valid strategy.
GBPJPY: Short Trading Opportunity
GBPJPY
- Classic bearish formation
- Our team expects pullback
SUGGESTED TRADE:
Swing Trade
Short GBPJPY
Entry - 199.63
Sl - 200.26
Tp - 198.44
Our Risk - 1%
Start protection of your profits from lower levels
Disclosure: I am part of Trade Nation's Influencer program and receive a monthly fee for using their TradingView charts in my analysis.
❤️ Please, support our work with like & comment! ❤️

GBPJPY - 1D SetupThe Japanese yen may get stronger for a while due to the weakening of the British Economy, which may lead to a pullback of the GBPJPY currency, and this seems to be a good trading opportunity in sells with a strict stop-loss. OANDA:GBPJPY
Note- This is my own view and not a financial advice as trading comes with high risk.

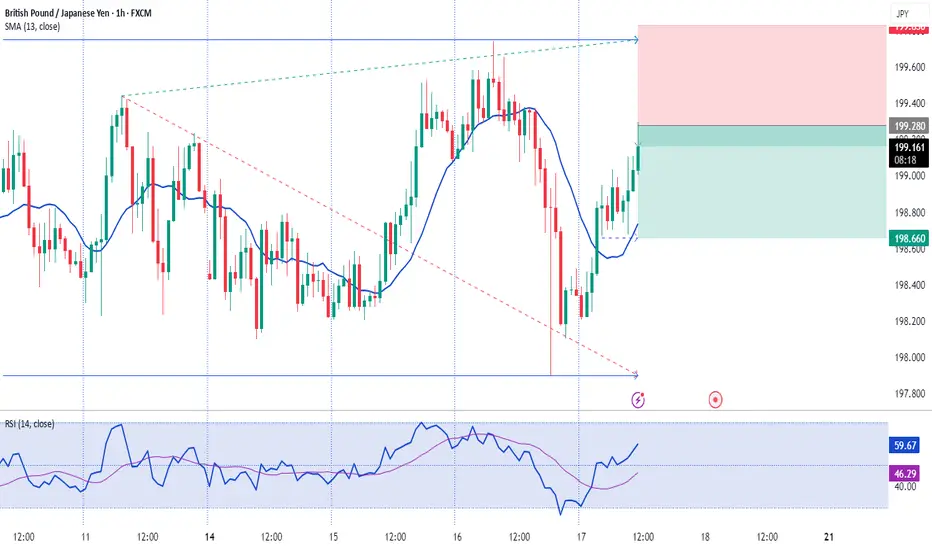
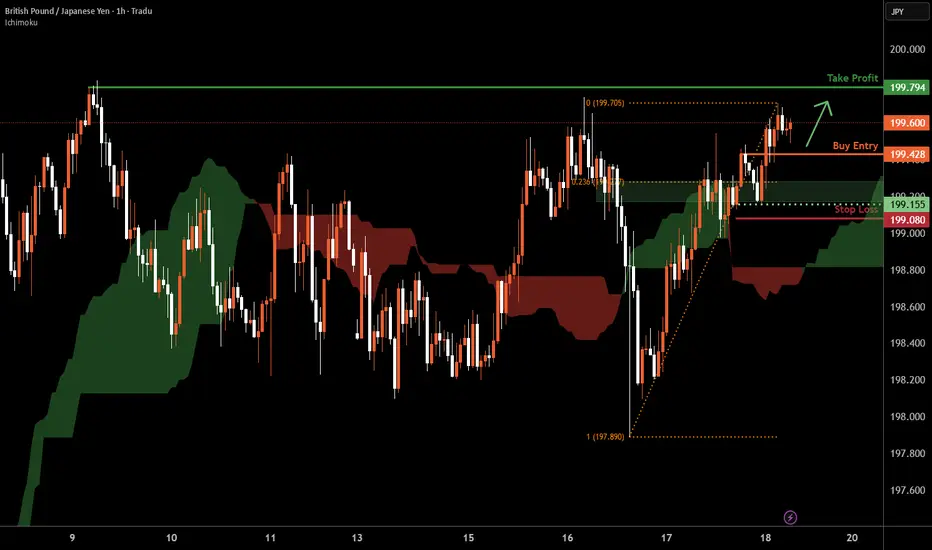
GBP/JPY H1 | Bullish uptrend to extend higher?GBP/JPY is falling towards a pullback support and could potentially bounce off this level to climb higher.
Buy entry is at 199.42 which is a pullback support.
Stop loss is at 199.08 which is a level that lies underneath a swing-low support and the 23.6% Fibonacci retracement.
Take profit is at 199.79 which is a swing-high resistance.
High Risk Investment Warning
Trading Forex/CFDs on margin carries a high level of risk and may not be suitable for all investors. Leverage can work against you.
Stratos Markets Limited (tradu.com ):
CFDs are complex instruments and come with a high risk of losing money rapidly due to leverage. 66% of retail investor accounts lose money when trading CFDs with this provider. You should consider whether you understand how CFDs work and whether you can afford to take the high risk of losing your money.
Stratos Europe Ltd (tradu.com ):
CFDs are complex instruments and come with a high risk of losing money rapidly due to leverage. 66% of retail investor accounts lose money when trading CFDs with this provider. You should consider whether you understand how CFDs work and whether you can afford to take the high risk of losing your money.
Stratos Global LLC (tradu.com ):
Losses can exceed deposits.
Please be advised that the information presented on TradingView is provided to Tradu (‘Company’, ‘we’) by a third-party provider (‘TFA Global Pte Ltd’). Please be reminded that you are solely responsible for the trading decisions on your account. There is a very high degree of risk involved in trading. Any information and/or content is intended entirely for research, educational and informational purposes only and does not constitute investment or consultation advice or investment strategy. The information is not tailored to the investment needs of any specific person and therefore does not involve a consideration of any of the investment objectives, financial situation or needs of any viewer that may receive it. Kindly also note that past performance is not a reliable indicator of future results. Actual results may differ materially from those anticipated in forward-looking or past performance statements. We assume no liability as to the accuracy or completeness of any of the information and/or content provided herein and the Company cannot be held responsible for any omission, mistake nor for any loss or damage including without limitation to any loss of profit which may arise from reliance on any information supplied by TFA Global Pte Ltd.
The speaker(s) is neither an employee, agent nor representative of Tradu and is therefore acting independently. The opinions given are their own, constitute general market commentary, and do not constitute the opinion or advice of Tradu or any form of personal or investment advice. Tradu neither endorses nor guarantees offerings of third-party speakers, nor is Tradu responsible for the content, veracity or opinions of third-party speakers, presenters or participants.
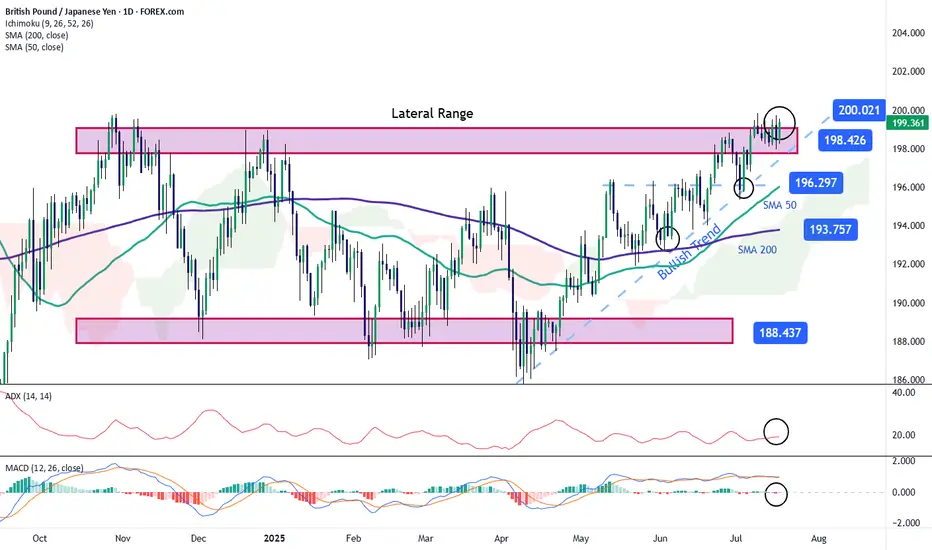
GBP/JPY: Pound Attempts to Break Out of a Broad Sideways RangeThe GBP/JPY pair has gained over 0.5% today in favor of the British pound, as the Japanese yen continues to weaken steadily. The recent escalation in the trade war, where potential 25% tariffs may begin to affect Japan in the short term, has contributed to the yen’s steady decline. For now, this remains one of the main catalysts behind the price movement, which is trending lower in the near term. As uncertainty surrounding the yen persists, buying pressure on GBP/JPY could become more significant.
Broad Sideways Range at Risk
Recent short-term bullish movements are beginning to test the upper boundary at 198.42, a key level within the broad sideways range that has dominated the chart in recent months. For now, the price could face a period of persistent neutrality as it tries to push through this upper barrier, which remains the most relevant resistance zone. If buying pressure holds steady over the coming sessions, the range could come under threat, potentially giving way to a more dominant and consistent bullish trend in the short term.
ADX
The ADX line is currently oscillating close to the 20 level, which typically indicates low average volatility over the past 14 sessions. This could be signaling a period of price consolidation, especially as the pair approaches current resistance zones.
MACD
The MACD histogram remains close to the zero line, suggesting a lack of clear direction in the short-term momentum of the moving averages. As long as this persists, it will likely reinforce the current neutral sentiment around resistance levels.
Key Levels:
200.00 – Tentative resistance zone, corresponding to the next psychological level to watch in the short term. Sustained price action above this level could confirm a breakout of the broad channel, paving the way for a dominant bullish trend.
198.42 – Nearby barrier, marking the upper boundary of the broad range. Sustained moves above this level could further reinforce the prevailing bullish bias.
196.297 – Key support level, marking the recent low. If selling pressure brings the price back to this area, the market could resume the broad sideways range seen in previous sessions.
Written by Julian Pineda, CFA – Market Analyst