GOLD Set for Big Move? | Key Zones + CPI Impact Explained !Gold Analysis – Key Levels + CPI Outlook!
In this video, I broke down the recent rejection from the $3366–$3369 resistance zone, the drop to $3346, and current price action around $3357.
We’ll also look ahead at what to expect with the upcoming CPI report — and how it could shape gold’s next big move.
📌 I’ve covered both bullish and bearish scenarios, shared key demand/supply zones, and outlined possible targets.
👉 For full context and trading strategy, make sure to watch the video till the end — and don’t forget to drop your opinion in the comments:
Do you think gold will break $3380 next, or are we headed for another pullback?
THE MAIN ANALYSIS :
GBPJPY

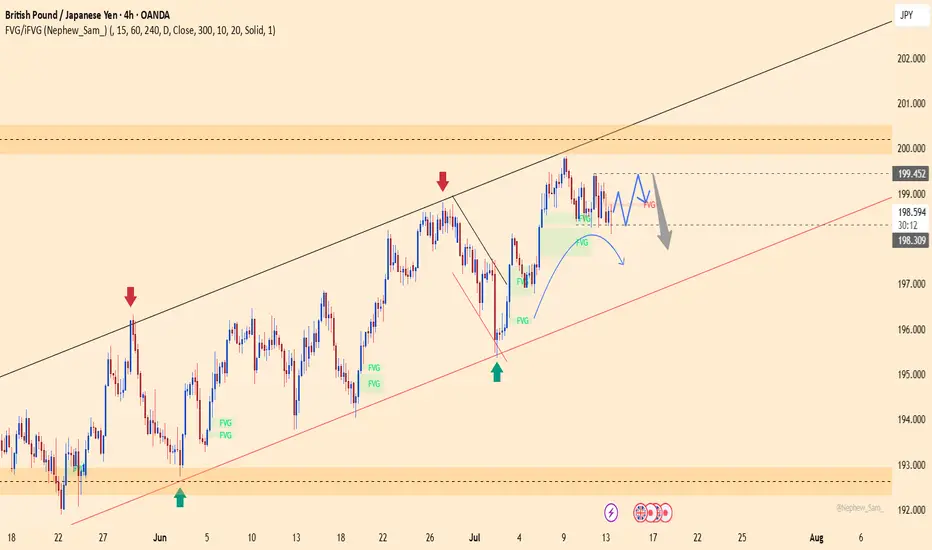
GBPJPY in Premium Zones of 2008 Financial Crisis - {17/07/2025}Educational Analysis says that GBPJPY (FX pair) may give trend Trading opportunities from this range, according to my technical analysis.
Broker - FXCM
So, my analysis is based on a top-down approach from weekly to trend range to internal trend range.
So my analysis comprises of two structures: 1) Break of structure on weekly range and 2) Trading Range to fill the remaining fair value gap
Will Jpy start to lose value like it is doing since 2019 or it will do free fall same like 2008 crisis.
Let's see what this FX pair brings to the table for us in the future.
Please check the comment section to see how this turned out.
DISCLAIMER:-
This is not an entry signal. THIS IS FOR EDUCATIONAL PURPOSES ONLY.
I HAVE NO CONCERNS WITH YOUR PROFIT OR LOSS,
Happy Trading.

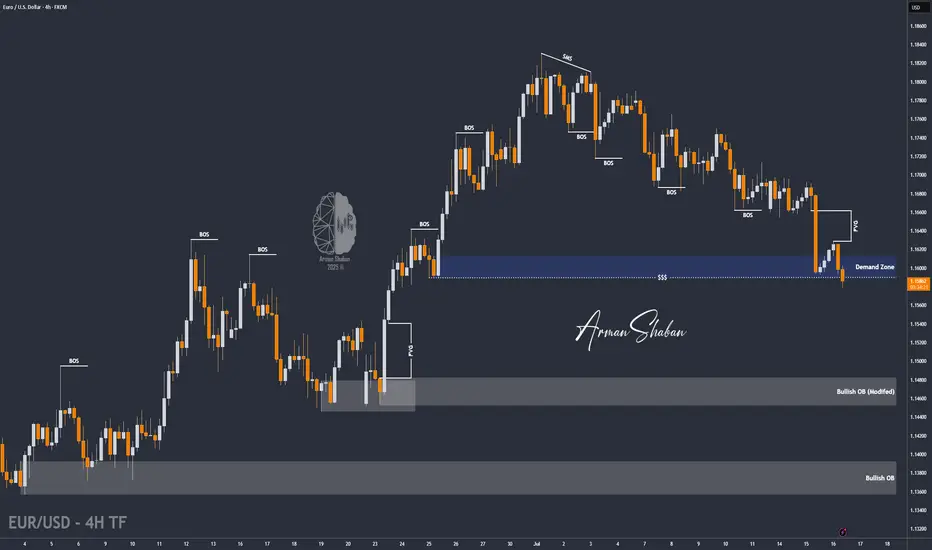
EUR/USD : Another Fall Ahead ? (READ THE CAPTION)By analyzing the EURUSD chart on the 4-hour timeframe, we can see that the price is currently breaking through the 1.16–1.158 zone. If it manages to hold below 1.159, we can expect further downside movement. The next targets for EURUSD are 1.15580, 1.154, and 1.148.
Please support me with your likes and comments to motivate me to share more analysis with you and share your opinion about the possible trend of this chart with me !
Best Regards , Arman Shaban
GBPJPY H4 I Bullish Bounce Off Based on the H4 chart analysis, we can see that the price is falling toward our buy entry at 198.65, a pullback support that aligns closely with the 61.8% Fib retracement.
Our take profit will be at 199.54, which is a swing high resistance level.
The stop loss will be placed at 197.98, which is a pullback support level.
High Risk Investment Warning
Trading Forex/CFDs on margin carries a high level of risk and may not be suitable for all investors. Leverage can work against you.
Stratos Markets Limited (tradu.com ):
CFDs are complex instruments and come with a high risk of losing money rapidly due to leverage. 66% of retail investor accounts lose money when trading CFDs with this provider. You should consider whether you understand how CFDs work and whether you can afford to take the high risk of losing your money.
Stratos Europe Ltd (tradu.com ):
CFDs are complex instruments and come with a high risk of losing money rapidly due to leverage. 66% of retail investor accounts lose money when trading CFDs with this provider. You should consider whether you understand how CFDs work and whether you can afford to take the high risk of losing your money.
Stratos Global LLC (tradu.com ):
Losses can exceed deposits.
Please be advised that the information presented on TradingView is provided to Tradu (‘Company’, ‘we’) by a third-party provider (‘TFA Global Pte Ltd’). Please be reminded that you are solely responsible for the trading decisions on your account. There is a very high degree of risk involved in trading. Any information and/or content is intended entirely for research, educational and informational purposes only and does not constitute investment or consultation advice or investment strategy. The information is not tailored to the investment needs of any specific person and therefore does not involve a consideration of any of the investment objectives, financial situation or needs of any viewer that may receive it. Kindly also note that past performance is not a reliable indicator of future results. Actual results may differ materially from those anticipated in forward-looking or past performance statements. We assume no liability as to the accuracy or completeness of any of the information and/or content provided herein and the Company cannot be held responsible for any omission, mistake nor for any loss or damage including without limitation to any loss of profit which may arise from reliance on any information supplied by TFA Global Pte Ltd.
The speaker(s) is neither an employee, agent nor representative of Tradu and is therefore acting independently. The opinions given are their own, constitute general market commentary, and do not constitute the opinion or advice of Tradu or any form of personal or investment advice. Tradu neither endorses nor guarantees offerings of third-party speakers, nor is Tradu responsible for the content, veracity or opinions of third-party speakers, presenters or participants.

GBPJPY RangingGBPJPY is still in the range. For this range we can trade between the zones drawn. It has taken previous day high already. There is S&R level and supply zone if gets buyer push and crosses previous week high we may expect further bullish momentum. Till now we can trade between zones if we see any bullish signs.

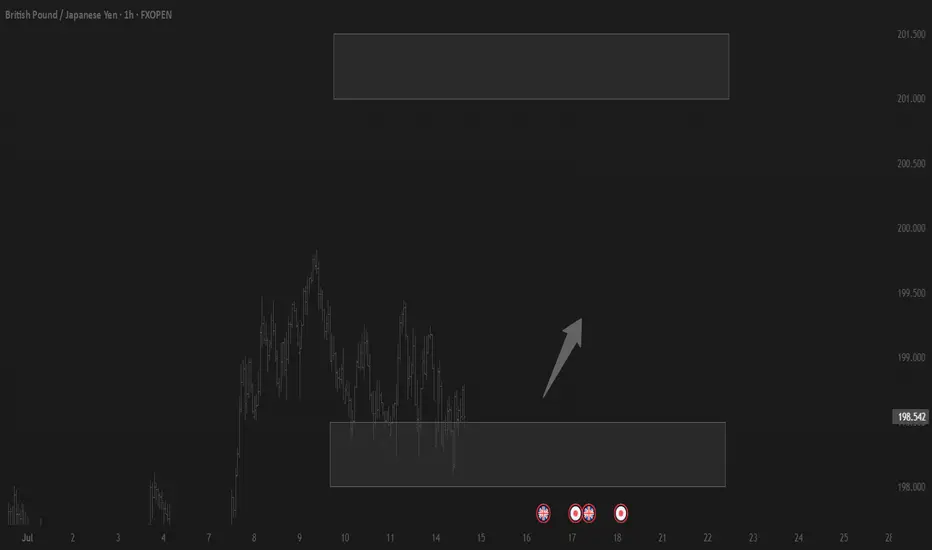
GBPJPY – Eyeing new highs as bullish structure holdsGBPJPY continues to trade within a steady ascending channel and has recently bounced from short-term support around 198.200. If price breaks above 199.400, bullish momentum could strengthen, targeting the previous high near 200.800 — a key resistance zone that has been rejected before.
From a fundamental perspective, expectations that the Bank of England will maintain high interest rates to combat inflation are supporting the pound. Meanwhile, investor sentiment remains cautious toward the yen following dovish signals from the Bank of Japan. If upcoming UK economic data is positive, GBPJPY may continue climbing in the sessions ahead.

GBPJPY A Fall Expected! SELL!
My dear subscribers,
My technical analysis for GBPJPY is below:
The price is coiling around a solid key level - 199.16
Bias - Bearish
Technical Indicators: Pivot Points Low anticipates a potential price reversal.
Super trend shows a clear sell, giving a perfect indicators' convergence.
Goal - 198.88
About Used Indicators:
By the very nature of the supertrend indicator, it offers firm support and resistance levels for traders to enter and exit trades. Additionally, it also provides signals for setting stop losses
Disclosure: I am part of Trade Nation's Influencer program and receive a monthly fee for using their TradingView charts in my analysis.
———————————
WISH YOU ALL LUCK
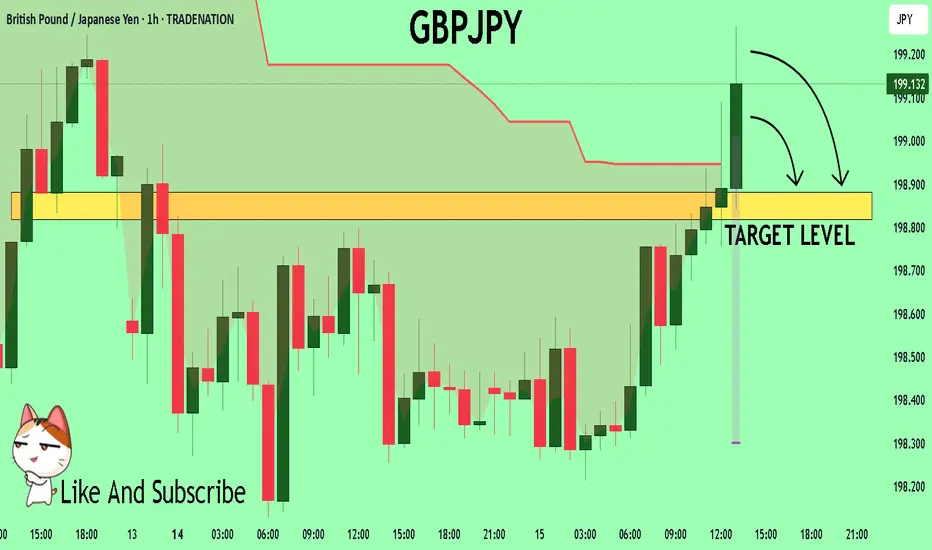
GBPJPY Will Grow! Buy!
Here is our detailed technical review for GBPJPY.
Time Frame: 1D
Current Trend: Bullish
Sentiment: Oversold (based on 7-period RSI)
Forecast: Bullish
The market is trading around a solid horizontal structure 198.531.
The above observations make me that the market will inevitably achieve 202.938 level.
P.S
The term oversold refers to a condition where an asset has traded lower in price and has the potential for a price bounce.
Overbought refers to market scenarios where the instrument is traded considerably higher than its fair value. Overvaluation is caused by market sentiments when there is positive news.
Disclosure: I am part of Trade Nation's Influencer program and receive a monthly fee for using their TradingView charts in my analysis.
Like and subscribe and comment my ideas if you enjoy them!

Falling Wedge Formation Ive been bullish on GBPJPY for a couple weeks now and I still believe that it has more upside potential. Here we have a Falling Wedge Formation. we have 4 touches on our pattern already and just waiting for a break and retest to enter again. I am currently in a position based of the retest price gave of the previous resistance (circled on chart). Lets see how it goes.

GBP/JPY H4 | Yen weakness to persist?GBP/JPY is falling towards a pullback support and could potentially bounce off this level to climb higher.
Buy entry is at 197.98 which is a pullback support that aligns with the 38.2% Fibonacci retracement.
Stop loss is at 196.68 which is a level that lies underneath a swing-low support and the 61.8% Fibonacci retracement.
Take profit is at 199.75 which is a swing-high resistance.
High Risk Investment Warning
Trading Forex/CFDs on margin carries a high level of risk and may not be suitable for all investors. Leverage can work against you.
Stratos Markets Limited (tradu.com ):
CFDs are complex instruments and come with a high risk of losing money rapidly due to leverage. 63% of retail investor accounts lose money when trading CFDs with this provider. You should consider whether you understand how CFDs work and whether you can afford to take the high risk of losing your money.
Stratos Europe Ltd (tradu.com ):
CFDs are complex instruments and come with a high risk of losing money rapidly due to leverage. 63% of retail investor accounts lose money when trading CFDs with this provider. You should consider whether you understand how CFDs work and whether you can afford to take the high risk of losing your money.
Stratos Global LLC (tradu.com ):
Losses can exceed deposits.
Please be advised that the information presented on TradingView is provided to Tradu (‘Company’, ‘we’) by a third-party provider (‘TFA Global Pte Ltd’). Please be reminded that you are solely responsible for the trading decisions on your account. There is a very high degree of risk involved in trading. Any information and/or content is intended entirely for research, educational and informational purposes only and does not constitute investment or consultation advice or investment strategy. The information is not tailored to the investment needs of any specific person and therefore does not involve a consideration of any of the investment objectives, financial situation or needs of any viewer that may receive it. Kindly also note that past performance is not a reliable indicator of future results. Actual results may differ materially from those anticipated in forward-looking or past performance statements. We assume no liability as to the accuracy or completeness of any of the information and/or content provided herein and the Company cannot be held responsible for any omission, mistake nor for any loss or damage including without limitation to any loss of profit which may arise from reliance on any information supplied by TFA Global Pte Ltd.
The speaker(s) is neither an employee, agent nor representative of Tradu and is therefore acting independently. The opinions given are their own, constitute general market commentary, and do not constitute the opinion or advice of Tradu or any form of personal or investment advice. Tradu neither endorses nor guarantees offerings of third-party speakers, nor is Tradu responsible for the content, veracity or opinions of third-party speakers, presenters or participants.

GBPJPY: Downside Pressure Increasing - Sell Opportunity!GBPJPY is showing clear signs of weakness, currently trading around 198.620. If it breaks and holds below 198.300, the bearish trend will be confirmed, with the next potential target at 192.000.
Upcoming key economic news from the UK (inflation, retail sales) and Japan (BOJ policy) will be decisive. Prioritize selling strategies, monitor news closely, and manage risk tightly.
$GJ (GBPJPY) 1HPrice is currently forming a descending triangle pattern, with clear lower highs and a horizontal support zone.
Trendline resistance is actively being respected.
Liquidity is likely building below the horizontal support zone.
A false breakout or sweep above the trendline followed by rejection could trigger institutional distribution.
As long as the descending trendline holds, and no bullish BOS occurs, the structure remains bearish. Look for price to accumulate short positions before expansion.

GBPJPY AccumulatingGBPJPY is building liquidity. We can see it around these zones. So trading between the zones will be wonderful. We can not say anything about the direction of GBPJPY right now because it is oscillating between the zones. The clear picture can be trade zones for scalping. No any potential move seen here.

GBPJPY Swing Trade Setup, Sell, Short SetupA Good RR setup, wait for the entry, when price reaches the poi, look for any weakness ltf and then take trade, we are taking trade on 1hr, so for entry look for 5m tf. I will update the trade status where to take or not!

Trading balanceTrading balance The price of the asset has rebounded from the balance zone. With the prospect of growth into the resistance zone.
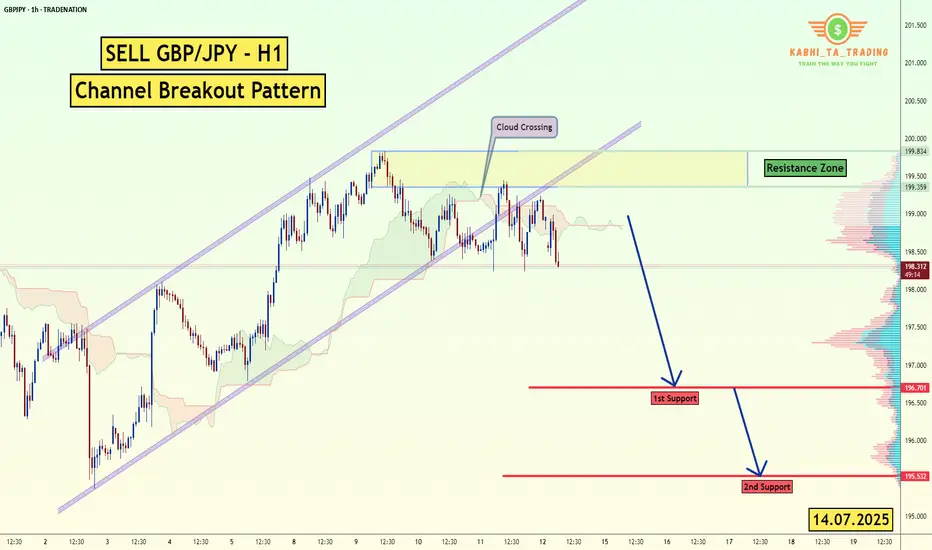
GBP/JPY -H1- Channel Breakout (14.07.2025)The GBP/JPY Pair on the H1 timeframe presents a Potential Selling Opportunity due to a recent Formation of a Channel Breakout Pattern. This suggests a shift in momentum towards the downside in the coming hours.
Possible Short Trade:
Entry: Consider Entering A Short Position around Trendline Of The Pattern.
Target Levels:
1st Support – 196.70
2nd Support – 195.53
🎁 Please hit the like button and
🎁 Leave a comment to support for My Post !
Your likes and comments are incredibly motivating and will encourage me to share more analysis with you.
Best Regards, KABHI_TA_TRADING
Thank you.
Disclosure: I am part of Trade Nation's Influencer program and receive a monthly fee for using their TradingView charts in my analysis.
GBPJPY is still in retracementWe can see from the graph GBPJPY is oscillating between the two S&R levels. For today we expect GJ to touch the demand zone and then go higher. Therefore we can expect GBPJPY in go further down and hit the demand zone because it is still retracing. The possibilities for the GJ are shown.

GBP/JPY) Bearish Analysis Read The captionSMC trading point update
Technical analysis of GBP/JPY on the 3-hour timeframe, suggesting a potential short-term pullback within a larger ascending channel.
---
Analysis Summary
Pair: GBP/JPY
Timeframe: 3H
Current Price: 198.883
Bias: Bearish move toward channel support
---
Key Technical Insights
1. Ascending Channel Formation:
Price is moving within an upward-sloping channel.
Current structure suggests price is heading toward the lower trendline support.
2. Support Level & Target Zone:
The yellow zone around 196.355 is a major support area and target point, coinciding with both structural support and the bottom of the channel.
3. EMA (200 Close):
Price is still above the 200 EMA (197.067), so overall trend remains bullish — but current move is a correction.
4. RSI (14):
RSI is neutral near 51.14, allowing room for further downward movement before becoming oversold.
---
Target Point
Target: 196.355 (support zone and bottom of channel)
---
Trade Idea
Direction Entry Stop-Loss Target
Sell 198.80–199.00 Above 199.70 196.35
SMC trading point
---
Summary
GBP/JPY is likely to retrace toward support at 196.35 before possibly bouncing within the larger bullish structure. This offers a short-term selling opportunity, with potential buy setups near the lower trendline later.
Please support boost 🚀 this analysis)

STEAL THIS TRADE! GBP/JPY Long Setup(Thief Trader’s Secret Plan)💰 Thief Trader’s GBP/JPY Heist Alert – Stealthy Long Setup Loading!
🌍 Greetings, Profit Raiders!
Hola, Konnichiwa, Ni Hao, Privyet, Hallo, Bonjour!
📢 Attention Market Bandits & Chart Pirates—the GBP/JPY Beast is ripe for plunder! Time to execute the next Thief Trader Masterplan.
🎯 Entry Zone – Loot the Dip!
Current price = Open vault. Fire longs now or snipe pullbacks (15M/30M charts recent swing low level).
Pro Thief Move: Stack buy limits near swing lows/highs. Chart alerts = your secret weapon. 🔫
🛑 Stop Loss – Guard the Treasure!
Swing Thieves: Hide SL below 2H swing low of candle wick @ (~197.000).
Day Raiders: Adjust SL to your risk size & order count. No free rides!
🎯 Profit Target – Escape with the Cash!
Take the 202.000 bag or exit early if momentum fades.
🔪 Scalpers vs. Swingers – Choose Your Weapon!
Scalpers (Quick Strikes): Longs only. No distractions.
Swing Traders (Patient Hunters): Trail stops & lock in gains.
🌪️ Market Pulse – Bullish Winds Blowing!
Price battling MA Resistance? No panic. Bulls still rule thanks to:
Fundamentals + Macro Trends
COT Data + Sentiment Shift
Quant Scores & Intermarket Alignments
(Check Linnkss for the full heist blueprint.)
⚠️ News Trap Warning!
Upcoming high-impact events? Freeze trades or tighten stops. Trailing SL = your escape route.
🚨 Join the Thief Trading Crew!
Like 👍 or Boost 🚀 this idea to fuel our next raid.
Thief Trader Tactics = Daily Market Domination. Your support keeps the heists alive! 💰❤️
🤑 Stay Locked In – The Next Big Score is Coming…
Timing is everything. Watch the charts. Strike hard. Exit smarter.

"GBP/JPY: High-Risk Pips Grab – Escape Before Cops! 🏴☠️ GBP/JPY "Dragon Heist" – Bulletproof Bullish Raid (High-Risk, High-Reward) 🚨
🔥 Attention Market Pirates & Profit Raiders! 🔥
(Day/Swing Trade Plan – Long Entry Focused)
🔑 Entry Zone (Vault Cracked!):
"The Dragon’s loot is unguarded! Bullish pullback = prime stealing opportunity."
Buy Limit Orders: Layer entries near 15M/30M swing lows (wick/body). DCA-friendly!
Thief Pro Tip: Scalpers ride long-only waves. Swing traders? Stack slowly, escape rich.
🎯 Target (Escape Routes):
200.600 (or bail early if cops (resistance) swarm!)
🚨 Red Zone = High-Risk Take-Profit (Overbought? Reversal? Police (bears) lurk here!)
⛔ Stop Loss (Emergency Exit):
4H Swing Low/High (Wick-based) – Adjust for risk/lot size!
No martyr trades! SL = your heist survival kit.
📢 Breaking News (Fundamental Edge):
Dragon’s bullish fuel? Macro data, COT reports, sentiment—CHEK THE LIiNKk 👉🔗 (Don’t skip homework!)
💣 Trading Alerts:
News = Landmines! Avoid new trades during releases.
Trailing SL = Your Getaway Car (Lock profits, dodge volatility.)
💥 Boost This Heist!
Smash 👍, hit 🔔, and fund our next raid! Every boost = more stolen pips for the crew.
Stay tuned—another heist drops soon! 🤑 #ForexBandits

GBPJPY: floating at the top – is a drop being loaded?GBPJPY is hovering around 198.91 after an impressive rally, but now it's trapped between two key zones: 199.85 – a resistance level that keeps rejecting price, and 198.20 – a fragile support below. The price action reveals a tense sideways pattern, like a spring coiling up before release.
What’s concerning is that buyers have attempted to break above the high multiple times and failed – and each failure comes with weaker rebounds. With the Bank of England shifting toward a “pause” stance and the yen gaining mild support from rising risk-off sentiment, the market is starting to lean toward a correction.
If price breaks below 198.20, it could mark the beginning of a deeper slide back toward the lower boundary of the channel. Don’t be fooled by the silence – sometimes, calm is the precursor to a sharp fall.

GBP/JPY Low Risk BUYS - SWINGLOW RISK TRADE
If you prefer not to swing you can scalp buys on the pullbacks throughout the week ahead.
GBP/JPY - BULLISH ENGULFING CONFIRMED
A+ SETUP since it has touched
and respected our area of interest.
SL - 185.599
TP1 - 190
TP2 - 192.799
TP3 - 194.681

GBPJPY: Bullish Structure Still IntactGJ created a new HH then turned sideways. More consolidation or a deeper pull back could be seen before the next rally.
Last BOS: Break above 199.70 → confirmed bullish strength
H4 Demand Zone (Pullback): 198.30–198.60
Liquidity Above: Clean pools at 200.30 – 200.70
H1 Key Zone: 198.60–198.90 (H1 OB + unfilled FVG) → currently being tested.
Momentum Trigger: BOS above 199.30 to confirm buyers stepping back in.
M15 Micro-Structure: Slightly bearish (short-term), sweeping liquidity under 198.80.
What to Watch: M15 bullish BOS above 199.10–199.30 for intraday buy confirmation.
🟢Entry Zone 198.30 – 198.60
SL 197.90
TP1 199.70
TP2 200.30
TP3 201.00
❌ Bullish Invalidation
H1 close below 197.90 → bullish bias neutralized, expect deeper retrace into 197.20 – 197.50.
