Gbpjpy_outlook

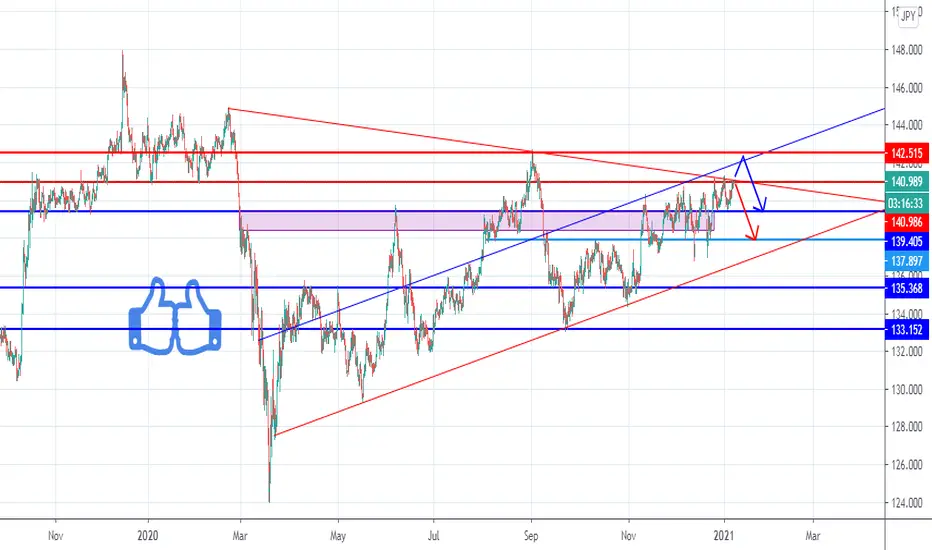
Pound/Yen-bull run failed!!! -Analysis - Pre-London - 21Jan2021 Please check the chart for the description.

GBPJPY, Breakout trend line, longGBPJPY, Breakout trend line and Bullish Continuation! Watch out Friends!


GBPJPY LONGReasoning for taking GBPJPY Long.
1. Daily and Weekly shows that we are at a double top area. (could be a strong reversal point to the downside)
2. 4hr still looks bullish. break of structure to the upside.
3. 61 fib retracement level held for potential upside continuation.
4. Potential upside target is at the very top of the double top area.


GBPJPY: The completion of the Diagonal PatternThe pattern has finished in the range of 142.26, we are waiting for a large drop in this currency. This analysis will be violated, if the price crosses the level of 142.72.

GBPJPY: The probability of Diagonal pattern formation In the daily chart, by checking the details of the waves we can see that wave i from the sub-waves of wave 3 has completed in the range of 133.04, we are currently in wave ii.
In the 240-minute diagram and in the details of wave 2 from sub-wave C, a diagonal pattern is forming which we can consider it as a terminated wave in the range of 142.03.
To confirm the main downtrend, the price needs to cross from the range of 139.51 with 5 descending waves.

GBPJPY under Pressure of Resistances (Ready for Bearish)Here in Gbpjpy, i've mentioned the level @141 as selling point for 200+ pips for today if it fall otherwise the above area i've taken the familiar trend line & from 142 approx considering the proper sell area in which fake design will occur (this is in case if today it isn't fall down). All other supports & resistances are mentioned there. Best of luck with GJ.
I HOPE THIS ANALYSIS GIVES YOU THE BETTER IDEA TO DO BEST.
Friends, push the like button, write a comment and share with your mates - that would be the best. THANK YOU!
P. S. I personally open a Trade when i find entry point according to my strategy, Always make your analysis before a trade.
The Single Best Trade for 2021... and beyond.
This trade naturally stands the reason. It is the worst G10 currency prospects versus what's still the most stable("best") G10 out there.
While Japan continues to maintain a healthy Account Surplus (for several decades by now) the UK decided to inflate the BoE's balance sheet to the tune of 120% of GDP, in just a few short months.
This fact alone justifies a complete re-pricing of this cross, without the need to speculate on the impending doom of the UK, a debt-ridden, rapidly aging, outpost (and Not just because of Brexit - which is a day late and a dollar short!) that is currently dying in the pandemic (economically and in the literal sense) faster than any other country in the developed world.
E.g. a total and rapid repricing of this pair is inevitable. (... and as we all know that, this pair can do that faster/better than any other pair in the majors!)
Here is the Monthly outlook
- And for those who wondered "what the 2nd best trade could be"...;


GBPJPY 4HRThe bullish break of structure occurred around the 137.90 handle. It's currently retesting the 137.90 handle where it's safe to place a short sell to minimum 136.385 handle. It should complete the D leg structure of Harmonics at that level and from there it should wise to place a buy, however in order for the bulls to get a stronghold it should break 139.813 handle.

GBP/JPY Technical Analysis
The counter has been in an ascending triangle formation.
Now, the range is narrowing and the pair is in a make or break situation.
We expect the pair to render a bullish breakout, however, we advise traders to go long only above 140.341.

GbpJpy at confluence supportIn my last GbpJpy analysis I said that I will sell this pair on confirmation. Since then GbpJpy dropped 100 pips and now is trading just at the confluence support.
A break here should accelerate losses and give scope to my 135 target.
Sellers can try to sell rallies and only a daily close above 140 would change my bearish outlook at this point

GbpJpy- sell after confirmationAfter 133 recent low, GbpJpy had a good run and is trading now at around 140.
This represents a strong horizontal resistance and also a psychological one.
I'm looking to enter short after confirmation with a 500 pips target at 1350 zone

GBPJPY MIXED IDEAGBPJPY is currently trapped in a narrow range, we expect a break up of the narrow range up or down to target the supply zone or demand zone

GBP/JPY Technical Analysis
The counter has been consolidating within a bearish flag pattern after the deep slide.
It hit the upper parallel of the pattern and then made a strong sell-off.
We expect the pair to move lower and break down in the short-term.

