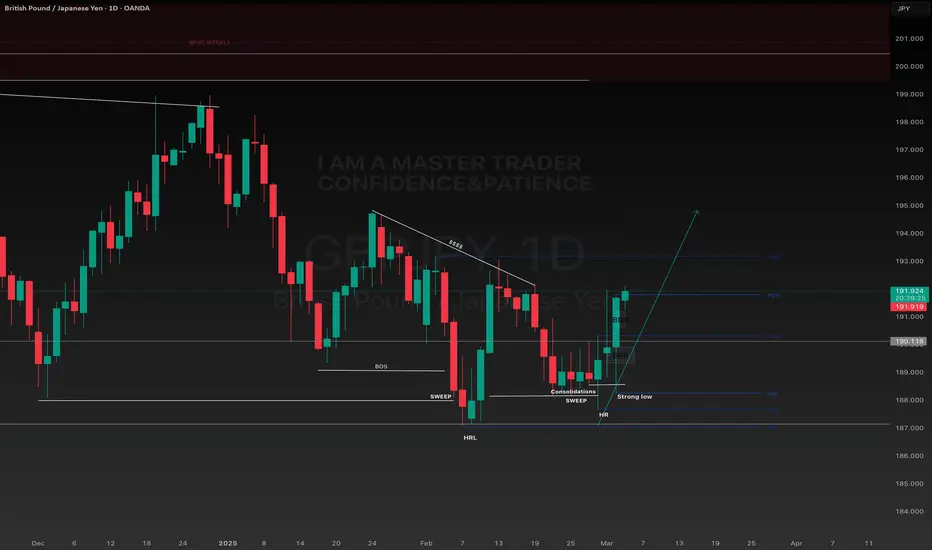
GBPJPY CONTINUATION?208 would be a optional target, but for better target is labeled on charts.
I bet the strong low being made at 180. so becareful on making decisions on your stop loss, I'm still asking about that strong low of 180. are all agree on this.?
This is only my view, but I bet this pair would continue to 219. 219 is my weekly charts view on longterm.
This is not a financial advice. what your thoughts on this? not a fan of this pair GJ.
Gbpjpyanalysis

GBPJPYHello friends
Given the good price growth, we can now buy in support areas during pullbacks that the price makes, of course with capital and risk management...
*Trade safely with us*

gbpjpy sell signal. Don't forget about stop-loss.
Write in the comments all your questions and instruments analysis of which you want to see.
Friends, push the like button, write a comment, and share with your mates - that would be the best THANK YOU.
P.S. I personally will open entry if the price will show it according to my strategy.
Always make your analysis before a trade

GBPJPY is in the Down TrendHello Traders
In This Chart GBPJPY HOURLY Forex Forecast By FOREX PLANET
today GBPJPY analysis 👆
🟢This Chart includes_ (GBPJPY market update)
🟢What is The Next Opportunity on GBPJPY Market
🟢how to Enter to the Valid Entry With Assurance Profit
This CHART is For Trader's that Want to Improve Their Technical Analysis Skills and Their Trading By Understanding How To Analyze The Market Using Multiple Timeframes and Understanding The Bigger Picture on the Charts

GBPJPY: +1200 Pips Swing Move in Making! Our last update on GBPJPY we had explained that price will bounce from the area that we had identified. We still think price will bounce again as price currently gathering enough volume before it makes any move.
Like and comment
❤️

gbpjpy sell signal. Don't forget about stop-loss.
Write in the comments all your questions and instruments analysis of which you want to see.
Friends, push the like button, write a comment, and share with your mates - that would be the best THANK YOU.
P.S. I personally will open entry if the price will show it according to my strategy.
Always make your analysis before a trade

GBPJPY is in the Down TrendHello Traders
In This Chart GBPJPY HOURLY Forex Forecast By FOREX PLANET
today GBPJPY analysis 👆
🟢This Chart includes_ (GBPJPY market update)
🟢What is The Next Opportunity on GBPJPY Market
🟢how to Enter to the Valid Entry With Assurance Profit
This CHART is For Trader's that Want to Improve Their Technical Analysis Skills and Their Trading By Understanding How To Analyze The Market Using Multiple Timeframes and Understanding The Bigger Picture on the Charts

DeGRAM | GBPJPY held the trend lineGBPJPY is in a descending channel between the trend lines.
The price is moving from the lower boundary of the channel, support level and lower trend line.
We expect the chart to rise after consolidating above the resistance level, which coincides with the 50% retracement level.
-------------------
Share your opinion in the comments and support the idea with like. Thanks for your support!

USDJPY and GBPJPY Analysis todayHello traders, this is a complete multiple timeframe analysis of this pair. We see could find significant trading opportunities as per analysis upon price action confirmation we may take this trade. Smash the like button if you find value in this analysis and drop a comment if you have any questions or let me know which pair to cover in my next analysis.

GBPJPY - MASSIVE Swing Potential Buy - Happening Now (March)This is a longer term swing idea.
Top down analysis from HTF indicates that:
- Push lower on JPYX Yen index
- Retrace higher on XXXJPY pairs
- Divergence in the Yen pairs, confirming a low
- Price Action has created a lot of liquidity on the downside, which has been taken, signifying upside.
Comment below if you have questions. Happy to help.
Peaceful Trading to you all.

GBPJPY Bulls Are Back In TownAs explained in the video, we have several bullish confirmations...
Key Sup 190.3
Key Res 193
- Bullish CHoCH
- Formed a new HH and HL
- H4 TL break and retest
- Retest of bullish OB
- Multiple bullish FVGs
- Bullish MACD
I have a small position open...
🟢BUY GJ 192.315
SL 191.6
TP1 192.515
TP2 192.815
TP3 193.315
TP4 194.315
Will scale in another position if we get a break and close above 193.

DeGRAM | GBPJPY growth in the channelGBPJPY is in a descending channel between the trend lines.
The price is moving from the lower boundary of the channel and the support level.
The chart is holding above the 62% retracement level.
We expect the pair to rise to the level of 193.
-------------------
Share your opinion in the comments and support the idea with like. Thanks for your support!

GBPJPY BULLISH OR BEARISH? TRADE IDEAGBPJPY Trade Idea | 1H Timeframe
Price recently tapped into a key supply zone / resistance trendline confluence, showing signs of a potential rejection from the liquidity grab area marked in yellow.
🔹 Liquidity Sweep above recent highs observed.
🔹 Price is reacting from the supply zone, indicating bearish intent.
🔹 Sell-side liquidity range marked below as potential target zone.
🔹 Expecting price to drop further toward 191.500 – 191.300 range after this minor pullback.
🎯 Entry: Around 192.400
🛑 SL: Above 193.300
✅ TP: 191.300 – Risk-Reward ~3.5R
A clean rejection setup after liquidity manipulation – following smart money concept.
Let me know your thoughts below 👇
#GBPJPY #SmartMoneyConcept #LiquiditySweep #ForexAnalysis #PriceAction #SMC #ForexTrading #SupplyAndDemand

USDJPY and GBPJPY AnalysisHello traders, this is a complete multiple timeframe analysis of this pair. We see could find significant trading opportunities as per analysis upon price action confirmation we may take this trade. Smash the like button if you find value in this analysis and drop a comment if you have any questions or let me know which pair to cover in my next analysis.

"GBP/JPY Short Trade Analysis – Successful Take Profit ExecutionThis is a GBP/JPY (British Pound/Japanese Yen) 1-hour chart from TradingView, showing a short trade setup with take profit (TP) levels and stop loss.
Key Observations:
Entry Point (Red Arrow)
The trader appears to have entered a sell (short) position at a resistance level, marked by the red arrow.
Price was likely rejected at this level, signaling a potential downward move.
Stop Loss (Red Box - Upper Zone)
The stop loss is placed above the entry point, at 192.386.
If the price moves above this level, the trade will be closed at a loss.
Take Profit Levels (Blue Lines)
TP1 (~190.750): First target for partial profit-taking.
TP2 (~190.000): Second target for further downside move.
Final TP (~189.275): If the price reaches this level, the trade will be fully closed in profit.
Trade Outcome
The chart annotation suggests that all TP levels were hit, meaning the price successfully moved downward after entry.
The trader made a successful short trade and secured profits.
Market Structure & Strategy:
The price initially moved up, but failed to break resistance, leading to a bearish rejection.
The trader likely identified this as a liquidity grab or false breakout, then entered a short position.
The price dropped and hit all take profit levels, confirming the trade's success.
Conclusion:
This was a well-planned short trade with proper risk management.
The risk-to-reward ratio looks good, with potential reward outweighing risk.
The trade was executed based on technical levels (support/resistance) and price action.

gbpjpy buy signal. Don't forget about stop-loss.
Write in the comments all your questions and instruments analysis of which you want to see.
Friends, push the like button, write a comment, and share with your mates - that would be the best THANK YOU.
P.S. I personally will open entry if the price will show it according to my strategy.
Always make your analysis before a trade

GBP/JPY SELL IDEA (R:R=4.8)I just placed a sell order for GBP/JPY at 191.700. We have a wonderful X BAT that just formed on the 1 HOUR chart.
Please trade with proper risk management, since we have news announcements coming out at 8:15 AM EST today.
ADP Non-Farm Employment Change
Stop Loss: 192.368 (Daily High)
Take Profit: 188.450
Happy Trading!

GBP JPY, BUYERS ON THE MOVE, Bullish candle breakthroughs the resistance supporting with a body displacement, I can anticipate that the price make turn and go bullish, as buyers making their move supporting pound and sellers dumping yen,
Confirmation after seeking Internal liquidity (PD ARRAYS) for reversal after hitting external liquidity or buy side liquidity
GBPJPY SellGBPJPY had a inverse head and shoulders right should possibly failing due to 15 break of structure to possibly continuing to the downside.

GBPJPY is Holding above the Support , All Eyes on BuyingHello Traders
In This Chart GBPJPY HOURLY Forex Forecast By FOREX PLANET
today GBPJPY analysis 👆
🟢This Chart includes_ (GBPJPY market update)
🟢What is The Next Opportunity on GBPJPY Market
🟢how to Enter to the Valid Entry With Assurance Profit
This CHART is For Trader's that Want to Improve Their Technical Analysis Skills and Their Trading By Understanding How To Analyze The Market Using Multiple Timeframes and Understanding The Bigger Picture on the Charts

GBP/JPY e Analysis & Probability Estimation March 4 2025Key Observations Across Timeframes:
1. Market Structure & Trend Analysis:
Short-term (M15, M30):
Price is consolidating near 189.200, testing the previous daily low (PDL) for liquidity.
A Break of Structure (BOS) occurred, signaling short-term bearish control.
The price is hovering at a key demand zone (PWL - 188.500/187.800).
If price breaks below 188.800, further downside is likely.
Mid-term (H1, H4):
The price rejected equilibrium (~189.800 - 190.000), showing weakness.
A Change of Character (ChOCH) to the downside suggests a bearish trend continuation.
Liquidity below PWL (187.800) could be a target before a potential bounce.
Long-term (D1):
The price is in a larger downtrend, failing to break above premium zones (~190.500 - 192.000).
Liquidity below PWL (~188.000 - 187.500) is uncollected, making it a likely target.
The next major support lies in the discount zone (~185.500 - 186.500).
2. Key Liquidity Zones & Supply/Demand Areas:
Premium Zone (~190.500 - 192.000): Major resistance; rejection happened here.
Equilibrium (~189.800 - 190.000): Price failed to hold above, signaling weakness.
Discount Zone (~187.500 - 186.500): Next strong demand area if price continues lower.
Previous Daily Low (PDL - 188.800): Price is testing this level for liquidity; a break here could lead to further downside.
Previous Weekly Low (PWL - 187.500): Untapped liquidity below, making it a strong target for price movement.
Probability-Based Scenarios:
1. Bearish Continuation to 187.800 - 186.500 (Break Below PDL & PWL)
Probability: 65%
Reasons:
Failure to hold above equilibrium (189.800).
Bearish BOS & ChOCH confirmations on H1/H4 suggest a move down.
Liquidity below 188.000 (PWL) remains uncollected.
Strong daily downtrend supports further downside.
Bearish Confirmation:
If price breaks and holds below 188.800, expect a move toward 187.500 - 186.500.
2. Bullish Reversal from Discount Zone (Bounce from 188.500 - 187.500)
Probability: 35%
Reasons:
Potential liquidity grab at PWL (188.000 - 187.500) before reversing.
Demand zone at 187.500 - 186.500 could cause a bullish reaction.
If price holds above 188.800, we may see a bounce to 189.800 - 190.000.
Bullish Confirmation:
If price fails to break below 188.500, a push back toward equilibrium (189.800) is possible.
Final Thoughts & Trade Plan:
Bearish bias (65% probability) for continuation toward 187.800 - 186.500.
Key Confirmation Levels:
Below 188.800: Bearish toward 187.500 - 186.500.
Above 189.200: Potential bullish recovery toward 189.800 - 190.000.
Trade Setup Overview:
Bias: Bearish (65% probability)
Entry Type: Breakout & Retest
📉 Sell (Short) Trade Setup:
🔴 Entry: Below 188.800 (Confirmed BOS)
🎯 Take Profit (TP) Targets:
TP1: 188.200 (PWL - Previous Weekly Low)
TP2: 187.800 (Liquidity sweep level)
TP3: 186.500 (Major discount zone)
🛑 Stop Loss (SL): 189.400 (Above minor liquidity)
📊 Risk-to-Reward (R:R):
TP1: ~1:2
TP2: ~1:3
TP3: ~1:5
🔹 Confirmation Needed:
Strong candle close below 188.800 (Break & retest scenario)
No immediate bullish rejection at 188.500
📈 Buy (Long) Trade Setup (Lower Probability - 35%)
🟢 Entry: Above 189.200 (Bullish rejection & BOS)
🎯 Take Profit (TP) Targets:
TP1: 189.800 (Equilibrium zone)
TP2: 190.500 (Supply zone)
TP3: 191.500 (Major resistance)
🛑 Stop Loss (SL): 188.700 (Below structure low)
📊 Risk-to-Reward (R:R):
TP1: ~1:2
TP2: ~1:3
TP3: ~1:5
🔹 Confirmation Needed:
Price needs to hold above 189.200 with strong bullish momentum.
No immediate rejection from equilibrium (189.800).
🛠️ Execution Tips:
🔄 Wait for a clear breakout & retest before entering.
⚖️ Adjust lot size based on risk tolerance (~1-2% per trade).
🕰️ Monitor price action on the lower timeframes (M15/M30) for entry precision.

GBPJPY Finally Breaks Out Of Range: Should We Buy?I am buying GJ...
- BOS
- Bullish CHoCH
- Creating new HHs and HLs
- Retest of Bullish OB
- Sell side liquidity grab
Entry 189.347
SL 188.6
TP1 189.547
TP2 189.847
TP3 190.347
TP4 191.347
I have a price alert set for 190. Let's see how it goes...

GBP/JPY "The Beast" Forex Market Heist Plan🌟Hi! Hola! Ola! Bonjour! Hallo! Marhaba!🌟
Dear Money Makers & Thieves, 🤑 💰🐱👤🐱🏍
Based on 🔥Thief Trading style technical and fundamental analysis🔥, here is our master plan to heist the ˗ˏˋ ★ ˎˊ˗GBP/JPY "The Beast" ˗ˏˋ ★ ˎˊ˗ Forex Market. Please adhere to the strategy I've outlined in the chart, which emphasizes short entry. Our aim is the high-risk Green Zone. Risky level, oversold market, consolidation, trend reversal, trap at the level where traders and bullish thieves are getting stronger. 🏆💸Book Profits Be wealthy and safe trade.💪🏆🎉
Entry 📈 : "The heist is on! Wait for the breakout (187.700) then make your move - Bearish profits await!" however I advise placing Sell limit orders within a 15 or 30 minute timeframe. Entry from the most recent or closest low or high level should be in retest.
Stop Loss 🛑: Thief SL placed at (190.500) swing Trade Basis Using the 3H period, the recent / swing high or low level.
SL is based on your risk of the trade, lot size and how many multiple orders you have to take.
Target 🎯: 185.000 (or) Escape Before the Target
🧲Scalpers, take note 👀 : only scalp on the Short side. If you have a lot of money, you can go straight away; if not, you can join swing traders and carry out the robbery plan. Use trailing SL to safeguard your money 💰.
📰🗞️Fundamental, Macro, COT Report, Sentimental Outlook:
GBP/JPY "The Beast" Forex Market is currently experiencing a Bearish trend in short term, driven by several key factors.
˗ˏˋ ★ ˎˊ˗Fundamental Analysis˗ˏˋ ★ ˎˊ˗
Interest Rates: BoE at 4-4.5% (easing cycle), BoJ at 0.25-0.5%—yield gap narrows, mildly bearish for GBP/JPY.
Inflation: UK at 2.5-3% (cooling), Japan at 2.5% (persistent)—neutral, balances GBP vs. JPY strength.
Growth: UK GDP ~1-1.5%, Japan ~1%—both modest, neutral impact.
Trade: UK exports lag, Japan benefits from U.S. tariff shifts—bullish for JPY, bearish for GBP/JPY.
Risk Sentiment: Safe-haven JPY gains in risk-off—bearish pressure.
˗ˏˋ ★ ˎˊ˗Macroeconomic Factors˗ˏˋ ★ ˎˊ˗
U.S.: Fed at 3-3.5%, PCE 2.6%—USD softness aids GBP/JPY—bullish (Eurostat/U.S. data).
Eurozone: PMI 46.2—stagnation weakens EUR, indirectly supports GBP—bullish (Eurostat).
Global: China 4.5%, Japan 1%—slow growth, JPY safe-haven appeal—bearish (ECB forecasts).
Commodities: Oil $70.44—stable, neutral for GBP/JPY (global data).
Trump Policies: Tariffs shift trade to Japan—JPY strength, bearish for GBP/JPY.
˗ˏˋ ★ ˎˊ˗Global Market Analysis˗ˏˋ ★ ˎˊ˗
Forex Markets: GBP/USD at 1.2650, USD/JPY at 150.00—GBP resilience vs. JPY strength—mixed.
Equity Markets: FTSE 100 stable, Nikkei range-bound—neutral correlation.
Crypto/Commodities: Gold at $2,930—risk-off supports JPY—bearish.
˗ˏˋ ★ ˎˊ˗Commitments of Traders (COT) Data˗ˏˋ ★ ˎˊ˗
Speculators: Net short JPY ~140,000 contracts (down from 150,000)—fading bearishness, mildly bullish JPY.
Hedgers: Net long JPY ~90,000—exporters expect JPY strength, bearish for GBP/JPY.
Open Interest: ~280,000 contracts—steady interest, neutral.
˗ˏˋ ★ ˎˊ˗Market Sentiment Analysis˗ˏˋ ★ ˎˊ˗
Retail: 65% short GBP/JPY at 189.50 (global X posts)—contrarian upside—bullish potential.
Institutional: Cautious, favoring JPY in risk-off—bearish outlook.
Corporate: UK/Japan firms hedge at 190-192—neutral.
Social Media Trends: Bearish setups to 185.00—short-term bearish sentiment.
˗ˏˋ ★ ˎˊ˗Positioning Analysis˗ˏˋ ★ ˎˊ˗
Speculative: Longs target 192.00-194.00, shorts aim for 188.00-185.00.
Retail: Shorts at 190.00-191.00—squeeze risk if price rises.
Institutional: Leaning short GBP/JPY, eyeing JPY strength.
˗ˏˋ ★ ˎˊ˗Quantitative Analysis˗ˏˋ ★ ˎˊ˗
SMAs: 50-day ~194.00, 200-day ~193.00—price below both, bearish signal.
RSI: 45 (daily)—neutral, fading bearish momentum.
Bollinger: 188.50-190.50—price near lower band, potential bounce.
Fibonacci: 38.2% from 198.94-189.31 at 190.50—resistance above.
Volatility: 1-month IV 10%—±1.80 daily range.
˗ˏˋ ★ ˎˊ˗Intermarket Analysis˗ˏˋ ★ ˎˊ˗
GBP/USD: 1.2650—GBP holds vs. USD, bullish for GBP/JPY.
USD/JPY: 150.00—JPY weakens vs. USD, bullish for GBP/JPY.
XAU/USD: $2,930—gold rise, JPY safe-haven—bearish.
FTSE 100: Stable—neutral.
Bonds: UK 10-year 4%, Japan 0.9%—yield gap narrows, bearish.
˗ˏˋ ★ ˎˊ˗News and Events Analysis˗ˏˋ ★ ˎˊ˗
Recent: Trump tariff threats (25% Mexico/Canada, 10% China, Feb 25)—risk-off lifts JPY—bearish.
Upcoming: U.S. PCE today (Feb 28)—hot data strengthens USD, pressures GBP/JPY; soft data boosts risk-on, supports GBP—mixed impact.
Impact: Bearish bias today, PCE reaction pivotal.
˗ˏˋ ★ ˎˊ˗Next Trend Move˗ˏˋ ★ ˎˊ˗
Technical:
Support: 188.50-188.00
Resistance: 190.50-192.00
Below 188.50 targets 185.00; above 190.50 aims for 194.00.
Short-Term (1-2 Days): Dip to 188.00 if PCE lifts USD; rebound to 190.50 if risk-on prevails.
Medium-Term (1-3 Months): Range 185.00-195.00, tariff/JPY strength key.
˗ˏˋ ★ ˎˊ˗Overall Summary Outlook˗ˏˋ ★ ˎˊ˗
GBP/JPY at 189.50 faces bearish short-term pressure from JPY safe-haven demand (tariffs, risk-off) and technicals (below SMAs), despite GBP resilience vs. USD. COT shows fading JPY shorts, sentiment leans bearish, and PCE today could sway direction. A short-term dip to 188.00 is likely, with medium-term consolidation unless macro shifts favor GBP.
˗ˏˋ ★ ˎˊ˗Future Prediction˗ˏˋ ★ ˎˊ˗
Bullish: 192.00-195.00 by Q2 2025 if USD softens (DXY to 105), risk-on resumes, or BoE holds rates.
Bearish: 185.00-188.00 if JPY strengthens (USD/JPY to 145), tariffs escalate, or risk-off persists.
Prediction: Bearish short-term to 188.00 (PCE/USD strength), then cautiously bullish to 192.00 by mid-2025 (risk-on recovery).
📌Keep in mind that these factors can change rapidly, and it's essential to stay up-to-date with market developments and adjust your analysis accordingly.
⚠️Trading Alert : News Releases and Position Management 📰 🗞️ 🚫🚏
As a reminder, news releases can have a significant impact on market prices and volatility. To minimize potential losses and protect your running positions,
we recommend the following:
Avoid taking new trades during news releases
Use trailing stop-loss orders to protect your running positions and lock in profits
💖Supporting our robbery plan 💥Hit the Boost Button💥 will enable us to effortlessly make and steal money 💰💵. Boost the strength of our robbery team. Every day in this market make money with ease by using the Thief Trading Style.🏆💪🤝❤️🎉🚀
I'll see you soon with another heist plan, so stay tuned 🤑🐱👤🤗🤩
