GBPJPY Top-down analysis Hello traders, this is a complete multiple timeframe analysis of this pair. We see could find significant trading opportunities as per analysis upon price action confirmation we may take this trade. Smash the like button if you find value in this analysis and drop a comment if you have any questions or let me know which pair to cover in my next analysis.
Gbpjpyanalysis

Short GBPJPY : scalp ideaI am shorting GBPJPY as we're hitting a resistance detected on the 30 min chart.
Price action and bollinger bands are also showing that price might reverse.
Last indication is the cross on the RSI/MA indicator.

GBPJPYGBPJPY . Potential long opportunity.
With our last analysis on GBPJPY working out, we are still bullish on the pair with current elections going on. We are still extremely bullish on GBPJPY especially due to the reason BoJ (Bank of Japan) still can’t risk to raise their interest rates aggressively due to the downside risk on their stock market.
We have been waiting on the break of our previous TP (Take Profit) for us to continue to the upside. Our entry is at 199.182 , with SL (Stop Loss) sitting at 197.786 . Keep in mind we still have the gap on GBPJPY that has happened. Our TP (Take Profit) is sitting at 203.816 but we will trace it with our KL’s (Key Levels) marked with yellow lines. We will send out updates on this analysis.
PARAMETERS
- Entry: 199.182
- SL: 197.786
- TP: 203.816
KEY NOTES
- Last H4 on GBPJPY has closed bullish.
- We have broken past the last high.
- Breaks above our KL’s would result in higher prices.
Happy trading!
FxPocket

GBPJPY THROUGH THE ROOF !!GBP/JPY presents a compelling buy, driven by contrasting central bank policies. The Bank of England’s higher rates lend strength to the pound, while the Bank of Japan’s commitment to low rates continues to weaken the yen. This divergence creates a favorable buying environment, especially as Japan shows no signs of tightening its monetary stance. With additional support from strong technical levels and the UK’s resilient economic indicators, GBP/JPY is well-positioned for potential gains, making now a strategic moment for buyers to capitalize on this opportunity.

GBPJPYGBPJPY . Potential long opportunity.
This is an update on the previous analysis we have posted.
We have been waiting on the break of our KL (Key Level) 195.971 . Today we broke that level and made a pullback to our PBA 1 (Pullback Area) .
We believe that GBPJPY will continue to the upside with next levels to target at 199.180 where our TP (Take Profit) is sitting at. We were trading between our PBA’s since start of the month. Our SL (Stop Loss) is above our PBA 2 at 194.339 . Breaks below PBA 2 would result in break to the downside and we would see the price reach even lower prices.
PARAMETERS
- Entry: 195.774
- SL: 194.339
- TP: 199.180
KEY NOTES
- GBPJPY has broken below our KL (Key Level) 195.971.
- We have retested PBA 1 (195.600)
- Break below our SL could result in deeper pullbacks and breaks of PBA 2.
Happy trading!
FxPocket

GBP/JPY Ascending Channel Formed – Bullish Breakout AnticipatedThe GBP/JPY pair has formed a well-defined ascending channel, signaling potential upward momentum. A bullish breakout is expected as the price tests the upper resistance of the channel. Traders are advised to watch for a strong candle close above the resistance level to confirm the breakout. Volume spikes and a retest of the resistance-turned-support could strengthen the bullish continuation.

GBPJPY - Look for Continuation Long (SWING) 1:4!GBPJPY isn’t showing any signs of reversal yet, especially following the election of Japan’s new PM and the recent BOE decision to maintain interest rates. Technically, the price appears to be forming a symmetrical triangle, suggesting a potential breakout from the resistance trendline. If confirmed, this could propel the price to the next Supply Zone on the higher timeframe.
Disclaimer:
This is simply my personal technical analysis, and you're free to consider it as a reference or disregard it. No obligation! Emphasizing the importance of proper risk management—it can make a significant difference. Wishing you a successful and happy trading experience!

GBPJPY GOING CRAZYLots of bears indicators for GBP tonight, in addition to the news in a little more than an hour, it is expected to go down.

GBP/JPY Consolidation Tightens: Bulls Eyeing a Break Above 195.7After a strong correction and finding a bottom at 180 in early August, OANDA:GBPJPY began to recover, initially rising to the 193 zone.
Another leg down followed, but this time, bulls regained control at the 183.90 level, forming a higher low supported by a double bottom pattern.
The next upward move stalled at the 195 resistance, and the pair has since entered a consolidation phase.
However, the recent consolidation range is tightening, and it appears that the price is gearing up for an upward breakout.
I am slightly bullish on this pair, and a break with a daily close above the 195.70 resistance level would confirm this outlook, potentially leading to further gains toward the key 200 zone.
In the short term, interim resistance around 198 could also serve as a target for bullish traders.

GBPJPY sell signal. Don't forget about stop-loss.
Write in the comments all your questions and instruments analysis of which you want to see.
Friends, push the like button, write a comment, and share with your mates - that would be the best THANK YOU.
P.S. I personally will open entry if the price will show it according to my strategy.
Always make your analysis before a trade

GBPJPY: 1st Trade Of The Week Hit Final Target. What's Next?My Bullish bias hasn't changed. GJ hasn't found a ceiling yet so we're still looking for buys.
Our first trade was successful, giving us +100 pips. Now we are looking for some type of correction, pull back or bullish flag, then a continuation up.
Key Res around 196
Key Sup around 194.56
I will try to update if I decide to take a trade.

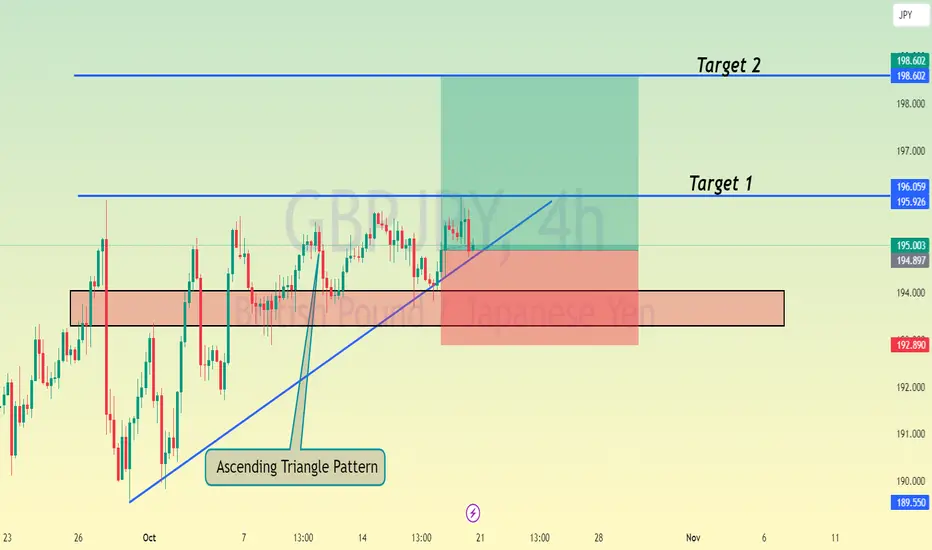
Formation of an Ascending Triangle Pattern , All Eyes on Buying Hello Traders
In This Chart GBPJPY HOURLY Forex Forecast By FOREX PLANET
today GBPJPY analysis 👆
🟢This Chart includes_ (GBPJPY market update)
🟢What is The Next Opportunity on GBPJPY Market
🟢how to Enter to the Valid Entry With Assurance Profit
This CHART is For Trader's that Want to Improve Their Technical Analysis Skills and Their Trading By Understanding How To Analyze The Market Using Multiple Timeframes and Understanding The Bigger Picture on the Charts
GBPJPY "The Guppy" Bank Money Heist Plan on Bullish SideBonjour! My Dear Robbers / Money Makers & Losers, 🤑 💰
This is our master plan to Heist GBPJPY "The Guppy" based on Thief Trading style Technical Analysis.. kindly please follow the plan I have mentioned in the chart focus on Long entry. Our target is Red Zone that is High risk Dangerous level, market is overbought / Consolidation / Trend Reversal / Trap at the level Bearish Robbers / Traders gain the strength. Be safe and be careful and Be rich.
Entry : Can be taken Anywhere, What I suggest you to Place Buy Limit Orders in 15mins Timeframe Recent / Nearest Swing Low
Stop Loss 🛑 : Recent Swing Low using 2H timeframe
Attention for Scalpers : If you've got a lot of money you can get out right away otherwise you can join with a swing trade robbers and continue the heist plan, Use Trailing SL to protect our money 💰.
Warning : Fundamental Analysis news 📰 🗞️ comes against our robbery plan. our plan will be ruined smash the Stop Loss. Don't Enter the market at the news update.
Loot and escape on the target 🎯 Swing Traders Plz Book the partial sum of money and wait for next breakout of dynamic level / Order block, Once it is cleared we can continue our heist plan to next new target.
Support our Robbery plan we can easily make money & take money 💰💵 Follow, Like & Share with your friends and Lovers. Make our Robbery Team Very Strong Join Ur hands with US. Loot Everything in this market everyday make money easily with Thief Trading Style.
Stay tuned with me and see you again with another Heist Plan..... 🫂

GBPJPY "The Guppy" Bank Money Heist Plan on Bullish SideHallo My Dear Robbers / Money Makers & Losers, 🤑💰
This is our master plan to Heist GBPJPY "The Guppy" Bank based on Thief Trading style Technical Analysis.. kindly please follow the plan I have mentioned in the chart focus on Short entry. Our target is Green Zone that is High risk Dangerous level, market is oversold / Consolidation / Trend Reversal / Trap at the level Bullish Robbers / Traders gain the strength. Be safe and be careful and Be rich 💰.
Note: If you've got a lot of money you can get out right away otherwise you can join with a swing trade robbers and continue the heist plan, Use Trailing SL to protect our money 💰.
Entry : Can be taken Anywhere, What I suggest you to Place Sell Limit Orders in 15mins Timeframe Recent / Nearest Swing High
Stop Loss 🛑: Recent Swing High using 2h timeframe
Warning : Fundamental Analysis news 📰 🗞️ comes against our robbery plan. our plan will be ruined smash the Stop Loss. Don't Enter the market at the news update.
Loot and escape on the target 🎯 Swing Traders Plz Book the partial sum of money and wait for next breakout of dynamic level / Order block, Once it is cleared we can continue our heist plan to next new target.
Support our Robbery plan we can easily make money & take money 💰💵 Follow, Like & Share with your friends and Lovers. Make our Robbery Team Very Strong Join Ur hands with US. Loot Everything in this market everyday make money easily with Thief Trading Style.
Stay tuned with me and see you again with another Heist Plan..... 🫂b

USDJPY and GBPJPY Top-down analysis Hello traders, this is a complete multiple timeframe analysis of this pair. We see could find significant trading opportunities as per analysis upon price action confirmation we may take this trade. Smash the like button if you find value in this analysis and drop a comment if you have any questions or let me know which pair to cover in my next analysis.

GBPJPY Still Consolidating But Slowly ClimbingGJ has been consolidating for awhile but my bias is still bullish. Waiting for price to break above and retest the H4 trend line.
Reasons For Bullish Bias:
- H1 Bullish Choch
- Still forming new HLs
- Small QP 193.75 holding as support
- Multiple rejections at the OTE fib on the H4
Major GBP news coming up in 3 hrs. If I see a trading opportunity after news I will let you know.

GBPJPY Sell OrderGBPJPY at 50% FIB retracement level, we can ee sell from current position with risk-reward ratio 2.
Mange your risk according to account size!

GBPJPY Continued To Range. What's Next?Last week we didn't get much movement from GJ. Price continued to range so my initial bias is going to be neutral starting this week. Price is currently at a QP 195 so GJ still has my attention.
Key Res around 195.98
Key Sup around 189.59
I will try to update as we get more development...

GBPJPY Will Go Down!GBP-JPY is going down
Now after the bearish
Breakout of the rising support
So after a potential local
Pullback we will be
Expecting a further move down !

GBP/JPY October Strategy: Bearish Reversal Confirmed with TDI
GBP/JPY October Market Analysis and Trading Outlook
The GBP/JPY monthly structure for October presents an open high-low-close pattern, signaling a potential sell setup. This bearish outlook has been confirmed by the TDI (Traders Dynamic Index) cross, indicating that it is now appropriate to consider sell entries.
Key Technical Highlights:
1. Daily Timeframe Open High Structure: On the daily chart, the price action for the month of October has established an open-high structure, which is often a precursor to a shift in momentum, supporting a bearish setup.
2. Consolidation and 'M' Pattern Formation: The price has been ranging at the highs, creating a period of consolidation. This consolidation resembles an 'M' pattern, a classic reversal formation seen at market exhaustion points. This pattern is significant as it suggests a potential reversal from the current high, reinforcing the bearish outlook.
3. Bearish TDI Cross Confirmation: A bearish TDI cross has occurred, signaling the presence of sellers in the market. This cross is a crucial technical indicator that validates the entry for sell positions.
Take Profit Levels:
- Take Profit 1: 193.000
- Take Profit 2: 192.000
Trading Advice:
Although the bearish TDI cross has provided confirmation, it is important to remain patient and ensure that other market conditions align with this setup. Always wait for valid signals and maintain proper risk management when executing trades.
If you find this analysis helpful, please like, comment, and follow for more updates. I’ll be sure to follow back. Best of luck with your trading endeavors!
---

GBPJPY → Trade Analysis | SELL SetupGBPJPY s moving to the upper boundary of the ascending channel.
The volatility of the movement has decreased.
The price has reached the resistance level.
Hello Traders, here is the full analysis.
I think we can soon see more fall from this range! GOOD LUCK! Great SELL opportunity GBPJPY
I still did my best and this is the most likely count for me at the moment.
-------------------
Traders, if you liked this idea or if you have your own opinion about it, write in the comments. I will be glad 🤝

GBPJPYSince we got many questions regarding GBPJPY here is our overall view on it.
GBPJPY has been struggling to break an important KL (Key Level) 195.971 . As of now we are trading below that KL. Breaking above it would give us a nice opportunity to enter in buys . However , if we continue to trade below 195.971 , and failing to break it, we could see more downside on the pair. Breaking below 193.990 and 193.290 would give us a nice opportunity to sell , possibly all the way down to the bottom of the range where our PBA 1 is sitting at roughly around 190.000 .
As of now there is no clear indication for buys or sells. Be patient and remember, sometimes the best trade is no trade at all.
We will be patiently waiting on breaks of our mentioned levels and we will post an update accordingly.
KEY NOTES
- GBPJPY is trading below an important KL.
- Break below 193.990 and 193.290 would confirm sells.
- Break above KL (195.971) would result in higher highs and confirm buys.
- No trade opportunity now, breaks should be waited on.
We would also like to take this chance to thank all of you for your support!
Happy trading!
FxPocket

GBPJPY is in the Down TrendHello Traders
In This Chart GBPJPY HOURLY Forex Forecast By FOREX PLANET
today GBPJPY analysis 👆
🟢This Chart includes_ (GBPJPY market update)
🟢What is The Next Opportunity on GBPJPY Market
🟢how to Enter to the Valid Entry With Assurance Profit
This CHART is For Trader's that Want to Improve Their Technical Analysis Skills and Their Trading By Understanding How To Analyze The Market Using Multiple Timeframes and Understanding The Bigger Picture on the Charts
