Today GBP/JPY target is really 188.400? Let's check the analysis📣 Hello Mates!
We can see GBP/JPY is currently running sideways with no clear direction. However, our prediction is that GBP/JPY will go for a sell and reach our targets of 188.980 and 188.400.
We have strong resistance levels at 190.100 and 191.350, along with strong support at 188.900 and 188.400. Although 188.960 is also a strong support level, we believe GBP/JPY will reach our targets of 188.980 and 188.400.
🔑 Remember, money management is crucial. Before employing our analysis, please conduct your own research and refrain from investing more than 2% of your portfolio.
📈 Our Resistance Levels are spotted at:
- 190.100
- 191.350
📉 And our Support Levels are set at:
- 188.960
- 188.400
Stay tuned for further updates and trade smartly! 📊
Gbpjpyanalysis

🎯Gbpjpy price is ready (Read the caption)Hi trader
Gbpjpy price trend to continue fly during
The season
It is expected that price will continue in
The buy trend and can approach the
Price range of 189.471
Note:
Always wish you to manage your capital safe
Take small lots of which suits your capital
The winner is the one who sticks with the market
Give us like and support

GBPJPY Top-down analysis Hello traders, this is a complete multiple timeframe analysis of this pair. We see could find significant trading opportunities as per analysis upon price action confirmation we may take this trade. Smash the like button if you find value in this analysis and drop a comment if you have any questions or let me know which pair to cover in my next analysis.

GBPJPY - Potential short ✅Hello traders!
‼️ This is my perspective on GBPJPY.
Technical analysis: Here we are in a bearish market structure from 4H timeframe perspective, as price started to form lower lows and lower highs, so I look for a short. I want price to continue the retracement to fill the imbalance and then to reject from bearish order block + institutional big figure 190.000.
Like, comment and subscribe to be in touch with my content!

GJ BUYGJ Head dropped a good +200 pips and now tapped into a main daily demand zone at 188.35 where I was looking for reversal formation. Reversal formation was formed at 9.30 once 30mins candle broke below Doji but then closed as a Bullish engulfing. Price also Broke structure to the upside .
Upon seeing I set a Buy limit order @188.500 and was waiting for Pre-Ny or NY for this. Stop loss @ 188.200 (risking 30pips).
TP1: 189.00. TP2:189.35 TP3: 189.85
* Where has the market moved since I entered my trade? at entry
* If I looked at the market now, would I take the same trade? Yes
* How do I feel about my trade? Optimistic
* What do I like about this trade ? Precise entry
* What do I dis-like about this trade now? Abit Stagnate
* On a scale of 1 to 10, where would I rate this Trade now? 7/10
* If I were not in a trade now, would I take the opposite trade ? no

GBPJPY I Forecast and Yen Fundamental Analysis Welcome back! Let me know your thoughts in the comments!
** GBPJPY Analysis - Listen to video!
We recommend that you keep this pair on your watchlist and enter when the entry criteria of your strategy is met.
Please support this idea with a LIKE and COMMENT if you find it useful and Click "Follow" on our profile if you'd like these trade ideas delivered straight to your email in the future.
Thanks for your continued support!

GBPJPY 1H BUY ORDER AT 190.400GBPJPY 1H The pair moved with Acending channel. Already Rebound with support. The best way to use this opportunity is to place a Buy order with,
🗣 BUY ORDER AT 190.400
🗣 TAKE PROFIT 01 190.60
🗣 TAKE PROFIT 02 190.90
🗣 STOP LOSS AT 189.90
The upcoming news will not influence your orders within the mentioned period.

GBPJPYPair : GBPJPY ( British Pound / Japanese Yen )
Description :
Rising Wedge as an Corrective Pattern in Long Time Frame with the Breakout of the Trend Line
RSI - Divergence
Completed " 1234 " Impulsive Waves and Rejection from Fibonacci Level - 38.20%
Bullish Channel as an Correction in Short Time Frame

GBPJPY Long term tradeI expect a general increase in the YEN strength. It's totally oversold and Nikkei index reached a crucial level. I think Japan's will start to reverse the trend soon. I expect a good drop on major XXX/JPY pair, and especially GBPJPY looks ready for a long term sell

GBPJPY and USDJPY Analysis TodayHello traders, this is a complete multiple timeframe analysis of this pair. We see could find significant trading opportunities as per analysis upon price action confirmation we may take this trade. Smash the like button if you find value in this analysis and drop a comment if you have any questions or let me know which pair to cover in my next analysis.

GBPJPY SELL TRADE GBPJPY SHORT TRADE ANALYSISAs of now, its Already touched their upper level a bit. Now
It will come back after touching a resistance which you can see on this Daily chart.
If we talk about the weekly trend, then the weekly Resistance also touched and now Trend will Change and market will go down as you can see in the chart
GBPJPY You can Short Now From 190.75
And you can set your target 200 to 250 Pips with this Short position

GBP/JPY Made H&S Pattern , Time To Get 250 Pips ?This Is An Educational + Analytic Content That Will Teach Why And How To Enter A Trade
Make Sure You Watch The Price Action Closely In Each Analysis As This Is A Very Important Part Of Our Method
Disclaimer : This Analysis Can Change At Anytime Without Notice And It Is Only For The Purpose Of Assisting Traders To Make Independent Investments Decisions.

GBPJPY Technical Analysis and Trade Idea (video)This is a video explaining my previous screenshot
On the higher time frame, the #GBPJPY exhibits a bullish trend with a recent retracement into an equilibrium zone. As we delve into lower timeframes, we want to lookout for specifically, a double bottom setup followed by a break below the previous lows, a robust rally, and subsequently, a higher low formation with retest and fail of a range at support.
However, it’s paramount to acknowledge the inherent risks associated with trading. Always conduct thorough research, considering both fundamental market drivers and the broader macroeconomic landscape, in addition to your technical analysis. Implement sound risk management strategies to safeguard your capital.
Disclaimer: This analysis provides a technical perspective on AAPL and should not be construed as investment advice. Tailor your trading decisions to your specific risk tolerance, informed by comprehensive market research and a holistic assessment of all relevant factors.

GBPJPY Technical Analysis and Trade IdeaOn the higher time frame, the GBPJPY displays a bullish trend with a recent retracement into an equilibrium zone. As we delve into lower timeframes (15m - 5m), we should closely monitor specific price action patterns. Look for signs of a double bottom setup followed by a break below the previous lows. Anticipate a robust rally and subsequently, a higher low formation with a retest and failure of a range at support.
However, it’s paramount to acknowledge the inherent risks associated with trading. Always conduct thorough research, considering both fundamental market drivers and the broader macroeconomic landscape, in addition to your technical analysis. Implement sound risk management strategies to safeguard your capital.
**Disclaimer:**
This analysis provides a technical perspective on GBPJPY and should not be construed as investment advice. Tailor your trading decisions to your specific risk tolerance, informed by comprehensive market research and a holistic assessment of all relevant factors.

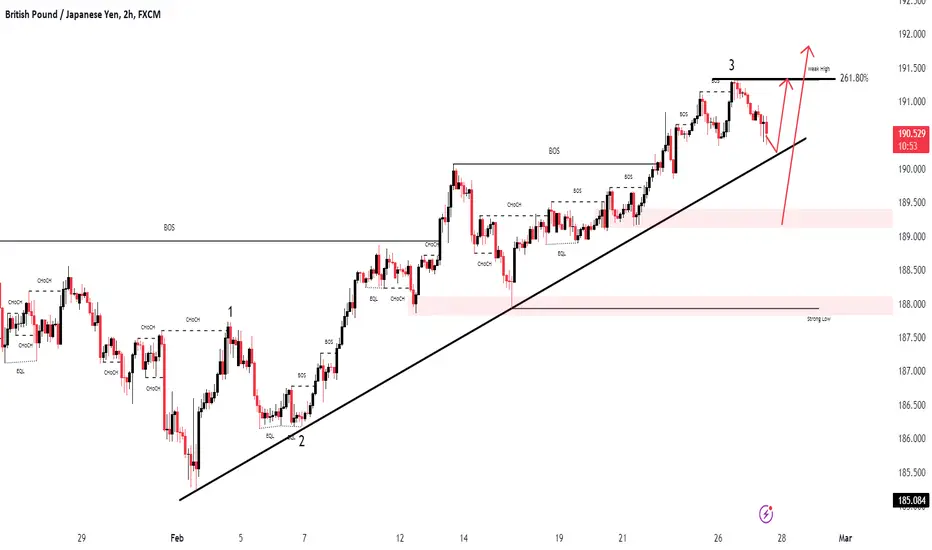
GBPJPY 27/02Pair : GBPJPY ( British Pound / Japanese Yen )
Description :
Bullish Channel as an Corrective Pattern in Short Time Frame
Completed " 123 " Impulsive Waves
Break of Structure
Rejection from Fibonacci Level - 261.8%
GBPJPY Turned BullishGBP/JPY has transitioned into a bullish trend, with the pound gaining strength against the yen. This uptrend could be attributed to various factors such as positive economic data releases from the UK, increased risk appetite in the market, or improving sentiment towards the British pound.

Gbpjpy is going to in higher zone ( What you think about gbpjpy Gbpjpy price of ready to fly
Gbpjpy price trend to continue buy
During session
It is expected that price will continue in
The buy trend and can approach
Note
Always wish you to manage your capital safe
Take small lots which suits your capital
The winner is the one who sticks with the
Market
Give us like and support us

GBPJPY OUTLOOKGBPJPY FEB WEEK 5 OUTLOOK -
Daily - this has been quite bullish lately. but considering the move already happened on GJ, it's looking too extended for me to enter at this price. however, if price comes back down to 188.520 and gets absorbed, I can look to go long.
Origin - Same here. GJ requires a deeper pullback to 189.369 - 189.089 zone and hold above it in order for me to look for long entry on GJ

GBP/JPY continues to trade in a volatile rangeHere is my analysis of the GBP/JPY for the upcoming week:
-
Applying the Quarters Theory, we have the major 189 and 191 levels, along with the half-figure of 190.50 and quarter points of 189.75, 190.25 and 190.75 to watch. Last week, 190.25 provided initial support on the pullback before lower demand emerged at 189.75. Meanwhile, the test of 191 was rejected and this area is likely to remain stubborn resistance.
Heading into this week, pay attention to whether the bulls can catalyze a convincing break above 190.75 and push towards 191 again. If selling pressure persists around 190.75, we could see another leg down to retest 189.75. Traders will be watching the quarter points for signals if directional conviction strengthens. A daily close above 190.75 would indicate upside momentum is accelerating for a potential run towards 191. (edited)

GBPJPY weekly analysis Hello traders here is my analysis for the GBPJPY, as you can see the price has been on a bullish trend for the past weeks and months but you can also see that it has reached a higher trend line and there are more chances that the price can reverse from now on to a bearish trend so now I will wait and look for reversing pattern so I can ride this trend downwards.

analysis gbpjpy sell signal. Don't forget about stop-loss.
Write in the comments all your questions and instruments analysis of which you want to see.
Friends, push the like button, write a comment, and share with your mates - that would be the best THANK YOU.
P.S. I personally will open entry if the price will show it according to my strategy.
Always make your analysis before a trade

GBPJPY 1.04% Return Trade ClosedGood Morning guys, I just not to long ago closed this buy on GBPJPY - I Took the trade yesterday evening and held it (during the Asian session overnight) I just woke up
Let me explain why I took this trade
These are my confirmations\questions >
Question 1 - Was GBPJPY in momentum (bullish or bearish)?
Yes, GBPJPY was in bullish Momentum at the time of me looking at it
Question 2 - Who was interested (at that time)?
Buyers were interested at that time
Question 3 - Where were their stop losses?
Stop losses would have been right below the highlighted levels (purple circles) & below the purple horizontal line (break out buyers)
Question 4 - Have those stop losses been taken out?
Yes I believe Stop losses would have been taken out already on GBPJPY (Red X)
Question 5 - Did the set up make sense for me to pursue?
Yes I believe it made sense for me to pursue this trade given the information I had
When I woke up GBPJPY had a moved a massive 1:7.55 RRR, considering the fact that I risked 0.25% on this trade that would have meant had I closed at that RRR I would have taken home about 1.88% on this trade
BUT, as you can see where I closed it, GJ had already pulled back a significant degree and in fear of it pulling back more and taking away more profit from me, I decided to close it (plus I'm going to be really busy today so I don't have the time to actively trail my stop as it goes further (which I do believe it can)
My broker also shows a gap (I use ICM, whereas FXCM (tradingview) does not show a gap, which means manipulation is occurring somewhere in this area
I closed the trade at 1.04% Return, doesn't sound like much but do the math on it from a much bigger account and tell me if you think it is worth it
Plus I literally have been having an excellent week where I haven't lost any trades for the week, I'm on fire this week, let's see if I can keep it up
I have many more confirmations I look for, this is just to simplify it so that I can quickly explain to you the reader
Downvote\don't Boost if you didn't read this post and didn't try to understand
OR
Upvote\Boost if you did read this post and did try to understand
*Why don't I show my lot size?*
*How much money I make is no where near as important as HOW I took the trade*

GBPJPY NEXT MOVE POSSIBLE Gbpjpy Is Almost Bullish We Have Best Buying Opportunity Around 188.30
For Next Target 190 To 192 Dont Miss This Opportunity Its Not A Signal
Afer Confirmation Signal Will Be Available Stay Tuned
