GJ-Tue-10/06/25 TDA-Claimant count change negative, GJ down!Analysis done directly on the chart
Follow for more, possible live trades update!
To understand if you are really for the long term trading
your mindset should not be if I make losses
I can always fund another account again or buy new challenges
but it shifts to how can I protect my capital so I will lose less
and in the future avoiding to make same mistakes?
Active in London session!
Not financial advice, DYOR.
Market Flow Strategy
Mister Y
Gbpjpyanalysis

GBPJPY Hello Traders,
There is a potential Buy opportunity on the pair, and I’d like to share it with you.
The setup provides an ideal buying condition, and I’ve configured the trade with a Risk-to-Reward Ratio of 1:2.
According to my personal entry model — which includes three different rating levels (a-b-c) — this setup has received the highest rating, which increases the likelihood of a successful outcome based on historical performance.
🔍 Trade Details
✔️ Timeframe: 15-Minute
✔️ Risk-to-Reward Ratio: 1:2
✔️ Trade Direction: Buy
✔️ Entry Price: 195.654
✔️ Take Profit: 196.179
✔️ Stop Loss: 195.391
🔔 Disclaimer: This is not financial advice. I’m simply sharing a trade I’ve taken based on my personal trading system, strictly for educational and illustrative purposes.
📌 Interested in a systematic, data-driven trading approach?
💡 Follow the page and turn on notifications to stay updated on future trade setups and advanced market insights.

GJ-Mon-9/06/25 TDA-Daily resistance tapped 196.096Analysis done directly on the chart
Follow for more, possible live trades update!
Price tapped daily resistance 196.096 and
currently rejecting ahead of this week multiple
red news folders (UK claimant count change,
USD CPI, PPI).
Active in London session!
Not financial advice, DYOR.
Market Flow Strategy
Mister Y

gbpjpy sell signal. Don't forget about stop-loss.
Write in the comments all your questions and instruments analysis of which you want to see.
Friends, push the like button, write a comment, and share with your mates - that would be the best THANK YOU.
P.S. I personally will open entry if the price will show it according to my strategy.
Always make your analysis before a trade

GBPJPY: Bullish As Long As 195 Hold As SupportI'm looking to buy GJ after a small retracement or breakout entry...
POI 195.2-195.4 which has a 50 and 62 fib confluence.
If no retracement, I will be looking for a breakout entry above 196.2
Let's wait and let the market come to us. Set those price alerts!

GBPJPY: 1050+ Pips Move! Will JPY continue dropping? In our previous analysis, we anticipated a similar move for GBPJPY, but the price dropped a bit further than expected. It’s now in a position to buy long, but please use accurate risk management as JPY pairs are likely to remain more volatile than ever. There are three targets you can keep an eye on: 197, then 200. Remember, trading involves risk, so make your own decisions.
Good luck and trade safely!
Thank you for your unwavering support! 😊
If you’d like to contribute, here are a few ways you can help us:
- Like our ideas
- Comment on our ideas
- Share our ideas
Team Setupsfx_
❤️🚀

#GBPJPY: +916 Pips Swing Buy Opportunity! Comment Down Your ViewThe FX:GBPJPY price has moved nicely from 187 to 191, almost +400 pips. I expect a small correction, but then the bullish move should continue towards the 200 region. You can set a target based on your analysis or set it at 200, whichever works for you. Good luck and trade safely.
Good luck and trade safely!
Thank you for your unwavering support! 😊
If you’d like to contribute, here are a few ways you can help us:
- Like our ideas
- Comment on our ideas
- Share our ideas
Team Setupsfx_
❤️🚀

GJ-Fri-6/06/25 TDA-Money flowing out of safe have assets, YEN!Analysis done directly on the chart
Follow for more, possible live trades update!
For those who don't understand safe haven assets
like YEN-Gold, it's gonna be really difficult to trade
these pairs.
These assets are heavily influenced by global events,
global tensions, trade wars, crisis.
Active in London session!
Not financial advice, DYOR.
Market Flow Strategy
Mister Y

GJ-Thu-5/06/25 TDA-Big pump and dump, pre and after US news!Analysis done directly on the chart
Follow for more, possible live trades update!
Trading news is not profitable long term, unless
you are really good fundamental analysis!
Yes, you might get lucky sometime that price
goes to your favor, but without a clear understanding,
bad risk management, no strategy you'll likely to lose
all the profits you make.
It's not just about making profits, you have to consistently
making it and keep the profits you make.
Active in London session!
Not financial advice, DYOR.
Market Flow Strategy
Mister Y

GBPJPY - Short Term Sell Trade Update!!!Hi Traders, on May 14th I shared this idea "GBPJPY - Looking To Sell Pullbacks In The Short Term"
I expected to see pullbacks and further continuation lower until the strong resistance zone holds. You can read the full post using the link above.
Pullback and push lower happened as per the plan!!!
If you enjoy this idea, don’t forget to LIKE 👍, FOLLOW ✅, SHARE 🙌, and COMMENT ✍! Drop your thoughts and charts below to keep the discussion going. Your support helps keep this content free and reach more people! 🚀
-------------------------------------------------------------------------------------------------------------------
Disclosure: I am part of Trade Nation's Influencer program and receive a monthly fee for using their TradingView charts in my analysis.

GJ-Wed-4/06/25 TDA-GJ strong push, will it continue?Analysis done directly on the chart
Follow for more, possible live trades update!
Trading is not easy, there are so many factors,
variants that influence the price movement.
Generally when big moves happen, it is caused
by big news, important speeches, flash news.
Markets don't move randomly, it's really important
to understand why price had this particular move,
at that specific time and ask why.
Not financial advice, DYOR.
Market Flow Strategy
Mister Y

gbpjpy sell signal. Don't forget about stop-loss.
Write in the comments all your questions and instruments analysis of which you want to see.
Friends, push the like button, write a comment, and share with your mates - that would be the best THANK YOU.
P.S. I personally will open entry if the price will show it according to my strategy.
Always make your analysis before a trade

GBPJPY is in the Down TrendHello Traders
In This Chart GBPJPY HOURLY Forex Forecast By FOREX PLANET
today GBPJPY analysis 👆
🟢This Chart includes_ (GBPJPY market update)
🟢What is The Next Opportunity on GBPJPY Market
🟢how to Enter to the Valid Entry With Assurance Profit
This CHART is For Trader's that Want to Improve Their Technical Analysis Skills and Their Trading By Understanding How To Analyze The Market Using Multiple Timeframes and Understanding The Bigger Picture on the Charts

GJ-Tue-3/06/25 TDA-From htf outlook, GJ quite messy zoneAnalysis done directly on the chart
Follow for more, possible live trades update!
More structure, more clarity, better trend identification.
On htf outlook, GJ is sitting in a complicated area.
Not a bad idea to risk low and preserve your capital with
this market condition and market positioning until more
clarity is shown.
Not financial advice, DYOR.
Market Flow Strategy
Mister Y

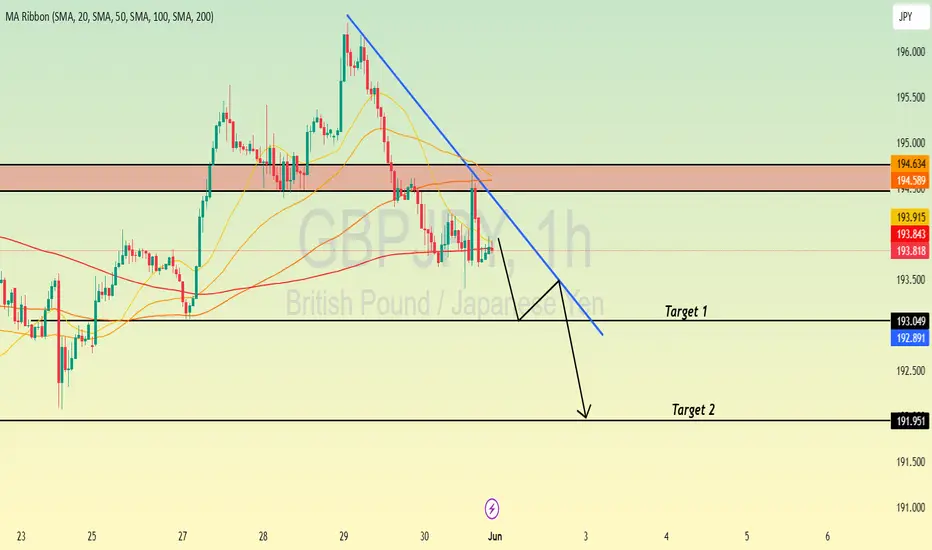
GBP/JPY Dips in Tokyo & London—What’s Next for Price Action?FenzoFx—GBP/JPY dipped from 194.6 during the Tokyo and London sessions, now trading around 193.1. Price is testing support near the May 27 low, ahead of the New York session.
A bounce from 193.0 could push GBP/JPY toward 193.5, with a bullish wave possible if price closes above that level, targeting 194.6. However, stabilizing below 193.0 would invalidate this outlook, with the next bearish target at 192.5.

GJ-Mon-2/06/25 TDA-GJ in ranging zone!Analysis done directly on the chart
Follow for more, possible live trades update!
My idea is the higher time frame you trade,
the more fundamental analysis you need to be
good at to actually be consistently profitable
trader. And viceversa if you trade lower timeframe
it's more technical analysis but always keeping
in mind the higher timeframe picture, doing the
top down analysis and having the basic necessary
knowledge on fundamental analysis.
Tips for basic fundamental knowledge:
1) Use economic calendar ( I recommend
FXstreet calendar for macroeconomic events
and Financial Juicy for flash news, real live updates)
2) Stay up to date with global news, war, tariffs etc.
As these are key factors that will influence price
currencies.
Not financial advice, DYOR.
Market Flow Strategy
Mister Y

GBP)JPY) Technical analysis setup Read The ChaptianSMC trading point update
Technical analysis of GBP/JPY (British Pound / Japanese Yen) on the 3-hour timeframe using Smart Money Concepts (SMC) and structure-based patterns.
---
Market Overview
Current Price: 193.808
EMA 200: 193.100 (acting as dynamic support)
RSI (14): 42.24 → Neutral/Bearish territory
---
Two Possible Scenarios (Bullish & Bearish)
Bullish Scenario
Zone of Interest: 193.1–193.5 (support area)
Price is hovering just above the support level and 200 EMA.
Double green arrows mark previous rejections = demand zone.
If price respects support and forms a higher low:
Possible rally to:
First Target: 196.415
Second Target: 198.838
Bearish Scenario
If price breaks below the yellow support zone and 200 EMA:
Clean path down to:
Target Point: 190.098 (marked strong support zone)
---
Zones of Importance
Support Level: 193.0–193.5 (minor support, under retest)
Strong Support Level: ~190.1 (high probability bounce zone)
Target Resistances:
196.415 (intermediate high)
198.838 (major resistance / swing high)
---
Trade Plan Summary
Direction Entry Zone SL Target R/R Potential
Long 193.1–193.5 Below 193.0 196.4 / 198.8 1:2 to 1:3+
Short Below 193.0 Above 194.0 190.1 1:2+
Mr SMC Trading point
---
Additional Notes
Watch price action closely at the support zone before entry.
RSI shows some bearish momentum but not oversold yet.
The outcome may be influenced by JPY strength and macro events (check economic calendar).
pales support boost 🚀 analysis follow)

GBPJPY is in the Down TrendHello Traders
In This Chart GBPJPY HOURLY Forex Forecast By FOREX PLANET
today GBPJPY analysis 👆
🟢This Chart includes_ (GBPJPY market update)
🟢What is The Next Opportunity on GBPJPY Market
🟢how to Enter to the Valid Entry With Assurance Profit
This CHART is For Trader's that Want to Improve Their Technical Analysis Skills and Their Trading By Understanding How To Analyze The Market Using Multiple Timeframes and Understanding The Bigger Picture on the Charts
GJ-Fri-30/05/25 TDA-Massive dump on GJ, now what?Analysis done directly on the chart
Follow for more, possible live trades update!
Time to reset, recharge!
Just like you train your body, it needs
recovery time.
Also your brain needs recovery time.
Not financial advice, DYOR.
Market Flow Strategy
Mister Y

GBP/JPY Elliott Wave Count Warns of Impending Sell-OffThe GBP/JPY pair has just completed a 5-wave downtrend, which ended around early April. Since then, the price has been moving higher in what appears to be a typical A-B-C corrective pattern — a common move that occurs after a major downtrend in Elliott Wave Theory.
We are currently in the final wave (C) of this correction, and within that, it appears that Wave 5 of C is now unfolding. This final wave appears to be nearing its end, and the price is approaching a strong resistance area between 196.813 and 197.513.
T1: 193.735
T2: 192.133
SL: 198.252
❌ Invalidation Level:
If the price closes above 198.252, this Elliott Wave count is likely wrong. That could mean the market is preparing for a bigger rally instead.

gbpjpy sell signal. Don't forget about stop-loss.
Write in the comments all your questions and instruments analysis of which you want to see.
Friends, push the like button, write a comment, and share with your mates - that would be the best THANK YOU.
P.S. I personally will open entry if the price will show it according to my strategy.
Always make your analysis before a trade

GJ-Thu-29/05/25 TDA-Possible buy above 4hR 196.283Analysis done directly on the chart
Follow for more, possible live trades update!
Asian session gave a good push, if you feel
missing out (FOMO). Don't worry, opportunities
will always be there.
Not financial advice, DYOR.
Market Flow Strategy
Mister Y

GBP/JPY 4H Chart Analysis – Bullish Channel Setup📈 Trend:
Price is moving in an ascending channel
🔵 Support line below
🔴 Resistance line above
---
Key Zones & Levels:
📍 Demand Zone (Buy Area):
Between 191.753 – 194.016
Price might bounce here before continuing up
🔵 Likely pullback expected here
🎯 Target Point:
202.500
🚀 If price respects the demand zone, this is the upside target
🟢 Entry Point:
Around 193.964 – 194.016
Optimal buying zone before the projected rise
❌ Stop Loss:
Below 191.700
🛑 Placed to minimize losses if price breaks down
---
Indicators:
📉 EMA (70):
Currently at 192.816
✅ Acting as dynamic support
---
Trade Plan Summary:
🔄 Wait for a retracement into the Demand Zone
🛒 Enter long near 193.964
⛔ Stop loss at 191.700
🎯 Target at 202.500
