GBPJPY: Bullish Structure Still IntactGJ created a new HH then turned sideways. More consolidation or a deeper pull back could be seen before the next rally.
Last BOS: Break above 199.70 → confirmed bullish strength
H4 Demand Zone (Pullback): 198.30–198.60
Liquidity Above: Clean pools at 200.30 – 200.70
H1 Key Zone: 198.60–198.90 (H1 OB + unfilled FVG) → currently being tested.
Momentum Trigger: BOS above 199.30 to confirm buyers stepping back in.
M15 Micro-Structure: Slightly bearish (short-term), sweeping liquidity under 198.80.
What to Watch: M15 bullish BOS above 199.10–199.30 for intraday buy confirmation.
🟢Entry Zone 198.30 – 198.60
SL 197.90
TP1 199.70
TP2 200.30
TP3 201.00
❌ Bullish Invalidation
H1 close below 197.90 → bullish bias neutralized, expect deeper retrace into 197.20 – 197.50.
Gbpjpybuy

GBPJPY: Still BullishPrice has pulled back and is currently reacting to H1 OB at 197.00–197.20
* FVG Support: Between 196.80–197.10
* Watch for: Bullish BOS above 197.50 to confirm buyers stepping back in
* Confirmation Needed: M15 bullish BOS above 197.50–197.60 for buy entry
🟢Entry: 196.80 – 197.10
Stop Loss: 196.4
TP1: 198
TP2: 198.6
TP3: 200
Breakout Option: If price pushes above 198.30 (M15 BOS + retest), you can enter.
❌ Bullish Bias Invalidation
H1 close below 196.40 → signals potential deeper retracement

GBPJPY...LONGPrice is nearing a critical level around . No setup, no trade. For me, a solid plan always comes before any prediction.
If the zone is broken and confirmed with a retest, I’ll adjust my plan accordingly for a possible reverse trade.

GBPJPY: Bullish Impulse May Take Price To 205! 700+ Pips MoveGBPJPY is in steady bullish move in other words it is in impulse move; price has not yet exhausted and there is still extended bullish move to completed before bears takes control over. Please use accurate risk management while trading and do your own analysis.
LIKE
COMMENT
SHARE
Good luck.
Team Setupsfx_

GBP/JPY Best Place To Buy Very Clear , Let`s Get This 200 Pips !Here is my 4H T.F Chart and if we check we will see that we have a very good support area very near the price now and we have already a good breakout and the price never retest the broken res and new supp so i`m waiting the price to retest it and give me any bullish price action and then we can buy it and targeting from 100 to 200 pips . and if we have a daily closure below my support then this idea will not be valid .

GBPJPY Hello traders.
The first trading opportunity of the day comes from the GBPJPY pair. The bullish scenario on this pair remains intact, and this is largely due to its strong correlation with USDJPY.
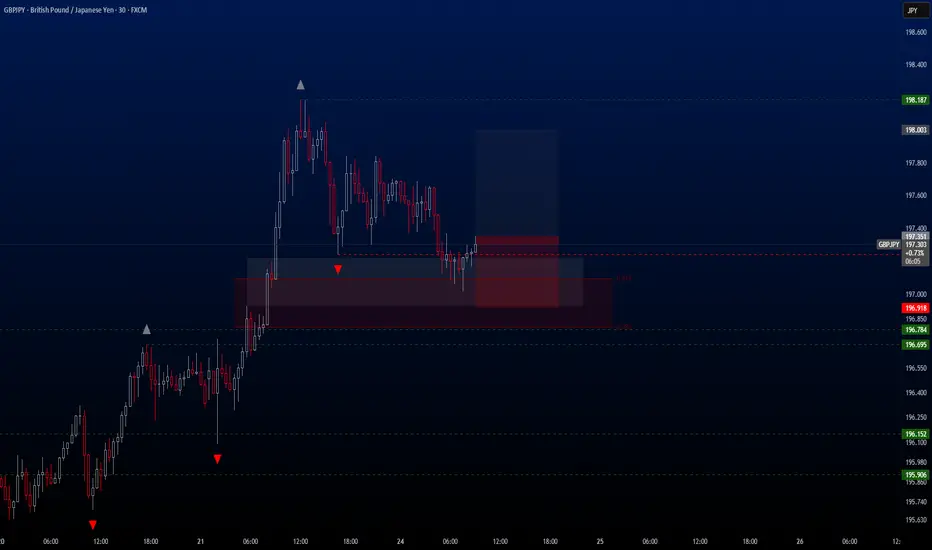
For the first time since May 17, USDJPY has climbed back to the 147.00 level, which has triggered momentum across all other JPY-related crosses. GBPJPY is one of the strongest beneficiaries of this movement, and we are now seeing a solid buy setup on the 30-minute chart.
I’ve personally entered the trade and am sharing the full breakdown with you below:
🔍 Trade Details
✔️ Timeframe: 30-Minute
✔️ Risk-to-Reward Ratio: 1:1.50
✔️ Trade Direction: Buy
✔️ Entry Price: 197.351
✔️ Take Profit: 198.003
✔️ Stop Loss: 196.918
🕒 If momentum weakens or the price stalls in a tight range, I will keep this trade open only until 23:00 (UTC+4). After that, I’ll close it manually—whether in profit or loss—depending on how price action evolves.
🔔 Disclaimer: This is not financial advice. I’m simply sharing a trade I’ve taken based on my personal trading system, strictly for educational and illustrative purposes.
📌 Interested in a systematic, data-driven trading approach?
💡 Follow the page and turn on notifications to stay updated on future trade setups and advanced market insights.
#GBPJPY: 600+ Pips Swing Move, JPY To Drop! GBPJPY has successfully rejected the area previously identified in our analysis of GJ. We had anticipated a price rejection and reversal with a strong bullish impulse, which has materialised. Following the positive candle close on Friday, we anticipate a continuation of the bullish trend and potential reaching of the 200 mark.
When trading, it is crucial to prioritise risk management. Conduct your own analysis and utilise this information solely for educational purposes.
Three potential targets have been identified: 198, 200, and 202. A stop loss can be positioned below our buying zone, as indicated by the black-marked zone.
Your support, expressed through likes, comments, and shares, is greatly appreciated and encourages us to continue providing valuable content.
❤️🚀
Team Setupsfx_

GBPJPY I Expect a Rally from the Buy Zone in the 1H Time FrameDescription:
I'm viewing the 195.116–194.845 range on GBPJPY as a strong buy zone. My target is 196.088. Once the trade setup becomes active or the target is reached, I’ll be sharing an update here. Stay tuned!
I meticulously prepare these analyses for you, and I sincerely appreciate your support through likes. Every like from you is my biggest motivation to continue sharing my analyses.
I’m truly grateful for each of you—love to all my followers💙💙💙

GBPJPY - Look for Long (INTRADAY) 1:4.5 and Short (SWING) 1:XXGBPJPY appears to remain in a distribution phase from the supply zone, making its way toward the next demand zone on the higher time frame. We might see a potential sell opportunity during any consolidation before the price continues trending toward the demand area.
Let’s wait and see how price action develops — there’s a chance for entries in both directions, but only if a clear consolidation forms. Otherwise, it’s best to remain patient and look for setups at the next key resistance level.
Disclaimer:
This is simply my personal technical analysis, and you're free to consider it as a reference or disregard it. No obligation! Emphasizing the importance of proper risk management—it can make a significant difference. Wishing you a successful and happy trading experience!

GBPJPY: Bullish As Long As 195 Hold As SupportI'm looking to buy GJ after a small retracement or breakout entry...
POI 195.2-195.4 which has a 50 and 62 fib confluence.
If no retracement, I will be looking for a breakout entry above 196.2
Let's wait and let the market come to us. Set those price alerts!

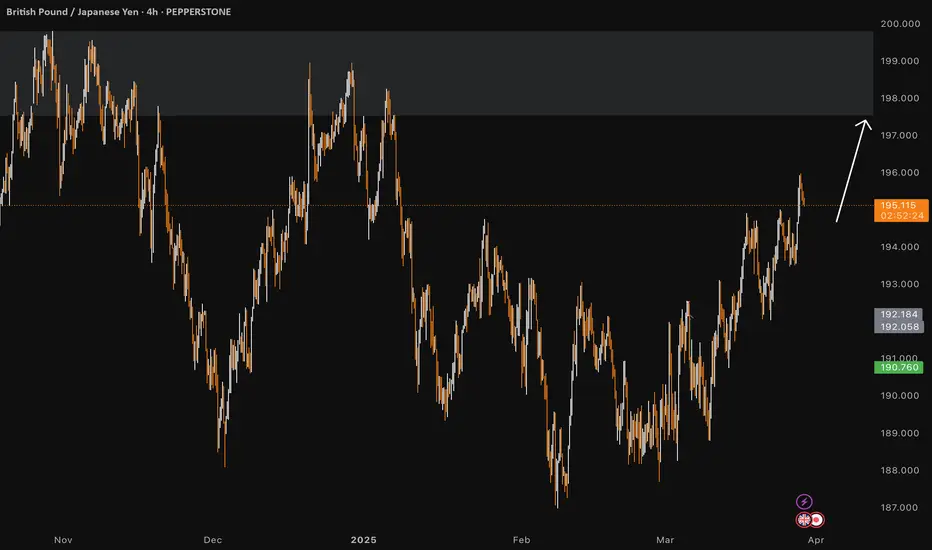
#GBPJPY: +916 Pips Swing Buy Opportunity! Comment Down Your ViewThe FX:GBPJPY price has moved nicely from 187 to 191, almost +400 pips. I expect a small correction, but then the bullish move should continue towards the 200 region. You can set a target based on your analysis or set it at 200, whichever works for you. Good luck and trade safely.
Good luck and trade safely!
Thank you for your unwavering support! 😊
If you’d like to contribute, here are a few ways you can help us:
- Like our ideas
- Comment on our ideas
- Share our ideas
Team Setupsfx_
❤️🚀

LONG ON GBP/JPYGJ has given us a double bottom at a major demand level.
I am looking to catch over 100 pips on GJ to the previous high.

GBP/JPY 4H Chart Analysis – Bullish Channel Setup📈 Trend:
Price is moving in an ascending channel
🔵 Support line below
🔴 Resistance line above
---
Key Zones & Levels:
📍 Demand Zone (Buy Area):
Between 191.753 – 194.016
Price might bounce here before continuing up
🔵 Likely pullback expected here
🎯 Target Point:
202.500
🚀 If price respects the demand zone, this is the upside target
🟢 Entry Point:
Around 193.964 – 194.016
Optimal buying zone before the projected rise
❌ Stop Loss:
Below 191.700
🛑 Placed to minimize losses if price breaks down
---
Indicators:
📉 EMA (70):
Currently at 192.816
✅ Acting as dynamic support
---
Trade Plan Summary:
🔄 Wait for a retracement into the Demand Zone
🛒 Enter long near 193.964
⛔ Stop loss at 191.700
🎯 Target at 202.500

GBPJPY - Expecting Bullish Continuation In The Short TermH1 - Strong bullish move.
Higher highs on the moving averages of the MACD.
No opposite signs.
Expecting further continuation higher until the two Fibonacci support zones hold.
If you enjoy this idea, don’t forget to LIKE 👍, FOLLOW ✅, SHARE 🙌, and COMMENT ✍! Drop your thoughts and charts below to keep the discussion going. Your support helps keep this content free and reach more people! 🚀
--------------------------------------------------------------------------------------------------------------------
Disclosure: I am part of Trade Nation's Influencer program and receive a monthly fee for using their TradingView charts in my analysis.

GBPJPY.. PULLBACK[ OANDA:GBPJPY ] is approaching the key resistance zone at .
I'm watching closely for a valid reaction before considering any position.
*** If the level breaks and price retests it successfully, I may consider a counter-directional setup.

GBPJPY UPDATE: BUY SignalBuy trade is floating +60 pips in profit running risk free. Final target is the unmitigated OB around 193.2.
ENTRY 191.193
SL 190.5
TP1 191.393
TP2 191.693
TP3 192.193
TP4 193.193

#GBPJPY:Three Positions Currently Opened, What about the next? Our three positions are currently open based on our last three ideas on GJ. We’re witnessing a strong bullish movement at the moment. Our next big target is 197, and then we aim for 200. Remember, trading involves risk, so take your own decisions.
Good luck and trade safely!
Thank you for your unwavering support! 😊
If you’d like to contribute, here are a few ways you can help us:
- Like our ideas
- Comment on our ideas
- Share our ideas
Team Setupsfx_
❤️🚀

GBP/JPY Should Take An Important Decision,Which One You Prefer ?If we checked this 2H Chart we will see that this pair should take a choice in the next few hours , we have this triangle and we have not any closure below or above to confirm the direction , so we will wait until clear breakout and when we have a closure we will follow the arrows to can enter a correct trade and we will targeting at least 100 pips .

GBPJPY IS A BUY (Britsh Pound-CPI News)TP: 190.00+
SL: 187.00
There is support forming for GBPJPY, which we could be looking for a buying opportunity. We have CPI news for the British Pound Dollar that could make this possible on Wednesday.

#GBPJPY: Will JPY Drop or Continue The Bullish Trend? As JPY strengthens, all ‘XXXJPY’ pairs sold heavily. This trade war scenario is uncertain, so it brings significant risk. If strong news supports the US DOLLAR, we’ll likely see a sharp price drop. Use accurate risk management and analyse before blindly following any advice.
Good luck and trade safely. We wish you the best.
Thanks for your support and love.
Team Setupsfx_

GBPJPY Discretionary Analysis: Aiming for the Sky I’m not entirely sure, but my gut says it’ll go up. If not, I lose some money and my gut clearly needs more back testing. Profit if I’m right, lesson if I’m wrong! 👌
Just my opinion, not financial advice.
#GBPJPY: +250 Pips From Last Idea Expecting A Strong Bulls! The GBPJPY currency pair experienced a decline to the 190 area, which represents a discounted price range. Subsequently, the price reversed positively by approximately 250 pips. Our market analysis remains unchanged, and we anticipate that the price will continue to exert dominance.
It is possible that the price may experience a correction or a downward movement, as we anticipate the release of strong economic data this week. This data is likely to influence the future trajectory of the currency pair.
We encourage you to like and comment for further insights. Your support has been invaluable throughout our journey, and we sincerely hope that you achieve success in your own market endeavours.
Team Setupsfx_
❤️🚀

#GBPJPY: 681+ Pips Buying Chance from a Key Level. Dear Traders,
Since the Japanese Yen (JPY) experienced a significant decline in the market, prices have risen. This analysis examines two key areas: the complex bullish price behaviour and the rejection of prices at levels we are currently monitoring for potential entry. While this chart analysis serves as a secondary reference, it should complement your own trading strategies.
Best regards,
Team Setupsfx_
