gbpjpy idea for this weekStill holding positions from 150.858 now up to 152.397 - Have a TP at 155.850 for remaining positions then will be looking at selling the dip. Would like to know other peoples opinions on this and if anyone is doing anything differently
Gbpjpybuy

Im going long on GBP/JPY this weekHere i have identified an opportunity to profit on a long position on the Gbp/Jpy currency pair for the week of December 18 2017. My target level is 151.100 or beyond before I look to sell again.

GBPJPY - H4 SWING TRADE - BUY THE BREAK OUTGbpJpy H4 chart - I prefer swinging longs on this for the next few weeks targets 155 and a decent risk to reward.
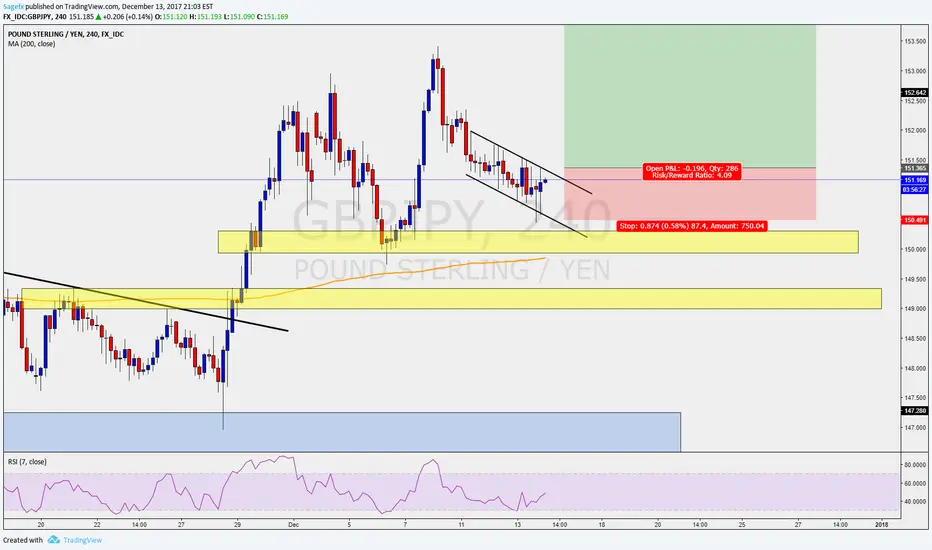
GBPJPY buying position above 150.10 with targets at 151.10 & 151.80 in extension.
Alternative scenario in break of 150.10, a continuation of the decline will be possible with 149,70 & 149,15 in line of sight.

GBPJPY Long Setup (Short Term)Longer term I am bearish on this pair but I do see room to the upside for another 150-200 pips.
This research is for informational purposes and should not be construed as personal advice. Trading any financial market involves risk. Trading on leverage involves risk of losses greater than deposits.
Please comment below and Like if you agree with my analysis.


GBPJPY : IS THE RISK WORTH IT?Hi traders!
GBPJPY is standing in a funny place. After a huge bull run was over, it was met by a healthy retracement. I'm getting plenty of different signal from this chart. I have 2 set of FIB extensions set in this chart because the up move was too strong and have super big gaps between the extensions.
I have one for the weekly & one for the daily. Also, I added a order block which has been bought and put the price over top of it. The price close over the daily 0.5 and it just under the 0.5 weekly. The RSI is saying the me that they are still more buyers than sellers for this pair. MACD is about the cross... but right on the edge of it.
So I'm looking what the GBP is doing vs other pairs and it looks positive. The same can be said of JPY who has shown weakness the last few days. If the price finds the momentum to go up, it will be a very nice push!
For all those reasons, here's what I'm seeing :
GBPJPY LONG
ENTRY : 149.90
SL : 149.117
TP : 154.306
Trade safe!
Disclaimer: This is my trading analysis, it is not an invite or recommendation to trade.

Buy GBPJPY Based on Bullish Harmonic Gartley Pattern 15min TFThis research is for informational purposes and should not be construed as personal advice. Trading any financial market involves risk. Trading on leverage involves risk of losses greater than deposits.
Please comment below and Like if you agree with my analysis.


Buy GBPJPY Short Term Based on Bullish Continuation - H4 + DailyThis research is for informational purposes and should not be construed as personal advice. Trading any financial market involves risk. Trading on leverage involves risk of losses greater than deposits.
Please comment below and Like if you agree with my analysis.

GBPJPY Long Term BULLOn the weekly time frame GBPJPY finally managed to break out from its long time resistance. You can see that in the past years it bounced back 3 times but this week it has finally broken it. This means 160+ is next for GBPJPY.
Keep in mind that this is the weekly time frame providing a long term view. There will be plenty of retracements and small corrections to sell.


Long GBPJPY Long Term Based on Bullish Gartley PatternWe've got a triple top on another idea, which we're waiting now for the break of a neckline for confirmation and the continuing drop will be in line with this Gartley pattern to complete Leg D. However, between the Targets 1 + Targets 2 of our Gartley pattern there is our 0.786 fib level, which we will be watching as the retracement for our Triple Top short trade entry - so keep an eye out at these levels.
This research is for informational purposes and should not be construed as personal advice. Trading any financial market involves risk. Trading on leverage involves risk of losses greater than deposits.
Please comment below and Like if you agree with my analysis.

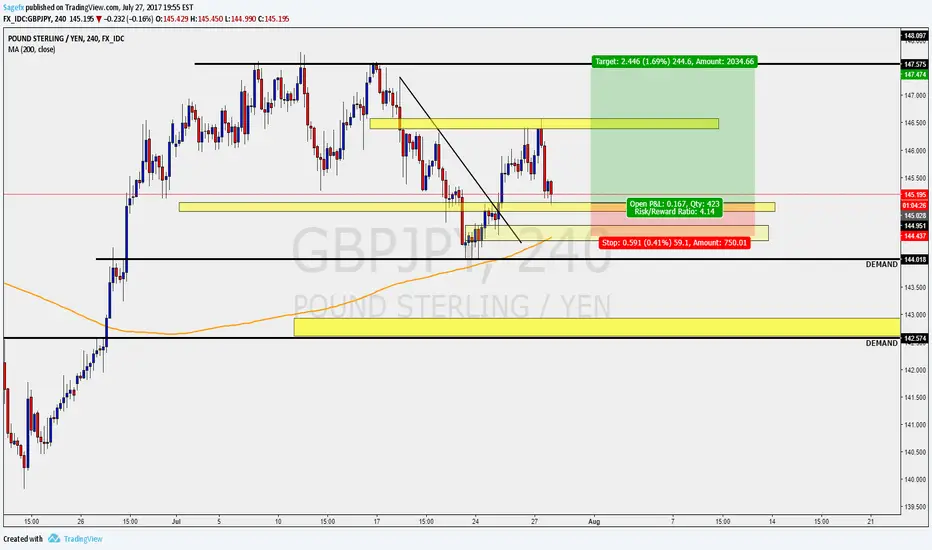
GBPJPYOur preference: buying position above 145.25 with targets at 146.10 and 146.55 in extension.
Alternative scenario: in break of 145,25, a continuation of the decrease will be envisageable with 144,80 & 144,45 in line of sight.
Comment: The RSI is bullish and militates for a continuation of the progression

GBPJPY - BUY H4 GbpJpy - H4 - I see price testing the H4 demand zone so good buy with a great risk to reward. Also potentially a long term buy on this pair so great entry
GBPJPYOur preference: buying position above 145.40 with targets at 146.85 & 147.15 in extension.
Alternative scenario: in break of 145,40, a continuation of the decrease will be envisageable with 145,15 & 144,75 in line of sight.
Comment: The RSI is well oriented.

GBPJPY Bull Party Has Only Just StartedGBPJPY is a perfect example of why you should also look at te higher time frames. If you would only look at the 30m, 1h, 4h, or even the daily you would quickly judge the GBPJPY has gone up a lot already and that it would be very logical to go back down again. How ever when you take a look and the weekly and monthly you see that price is still rather low and it actually just started its way back up.
This is also what we see here on the weekly time fame for GBPJPY. A long term upper range has been broken and its touching the same resistance now for the 3rd time. Which means chances of it breaking this time have only gone up.
So long term GBPJPY would be a beautifull buy position to hold on to and add more buys a long the way up!!!

GBPJPY h4 timezone Harmonic Patternharmonic pattern almost completed and GBPJPY Currently is at sell zone watch carefully and take good points entry good luck .

Longterm GBPY Long + Short Setup on 4H + 1D Charts 300-900 pips!Hope you all had a great weekend. Looks like our active trades are making great progress to start the week, so let's try to keep the momentum going!
The GBPJPY pair has been up trending on the Weekly chart since 3rd October 2016 and we can see price has touched down on the lower uptrend level a few times since then and has respected this trend line. Most recently we have come back down to this trend line and almost touched it today and so, we are expecting price to respect the trend line and bounce back up to continue it's trend pattern. On the weekly chart we can also see price hit a major resistance level on 12th of December 2016 and the 8th of May 2017 and was unable to break through, therefore our target TP will be just below this level with a return of 700 pips.
As we zoom into the daily + 4H charts, there is still some momentum to move down a little further. On the last two bounces, price was at 5% and 3% oversold on the daily chart and we only dropped to these levels when price touched the trend line and bounced up - Currently, price is 27% oversold so this would go in hand with our opinion that there is room to move down further before the bounce.
I have marked out some key support/resistance levels I want to keep an eye on as we monitor this trade setup. The conservative approach would be to wait for the bounce and enter above 141.3x for confirmation, however, I may just wait for the bounce and try to get in as low as possible and then keep a close eye on it.
On the flip side, with everything that is happening fundamentally... it is highly likely that the GBP will continue to fall and we may just see this pair break the trend line. I have marked out my potential targets for TP if we enter a sell instead of a long.
This research is for informational purposes and should not be construed as personal advice. Trading any financial market involves risk. Trading on leverage involves risk of losses greater than deposits.
Please comment below and Like if you agree with my analysis.


GBPJPYOur preference: position bought above 139.45 with targets at 140.80 & 141.20 in extension.
Alternative scenario: in break of 139.45, a continuation of the decline will be envisageable with 139.00 & 138.60 in line of sight.
Comment: The RSI is well oriented.

GBPJPY Buy Bounce BackGBPJPY is showing a nice buy setup on the 4 hour time frame and its also forming a cool bullish wedge on the daily time frame.
You can see that its has been trading nicely in its range now and is now inside that range also forming a bullish wedge from which its
about to break-out.

