GBPJPY Double Bottom at Structure!Hi guys,
i've been watching this pair for quite a while, price has finally reached the daily structure i wanted to. Here we have two harmonic patterns already completed (Bat and Gartley) and price has formed a nice double bottom with RSI divergence.
The first way you can trade it is by buying right now, with stops below the lows and targets at a minimum 1,25:1 RR.
The second way is by waiting to see a break of the trendline, that would also mean a break of the double bottom to the upside (and then a 2618 strategy), and buying at the first retracement.
That second way would be safer but you can also miss this trade.
Now it's up to you.
If you want to share your view, comment beneath.
Otherwise, see you in the next chart!
Gbpjpybuy

Two Harmonic Patterns at market on GBPJPYHi guys,
i've been watching this pair for quite a while, price has finally reached the daily structure i wanted to. Here we have two harmonic patterns already completed (Bat and Gartley) and price has formed a nice double bottom with RSI divergence.
The first way you can trade it is by buying right now, with stops below the lows and targets at a minimum 1,25:1 RR.
The second way is by waiting to see a break of the trendline, that would also mean a break of the double bottom to the upside (and then a 2618 strategy), and buying at the first retracement.
That second way would be safer but you can also miss this trade.
Now it's up to you.
If you want to share your view, comment beneath.
Otherwise, see you in the next chart!

GBPJPY buyPrice looks to have found a new support area as on several occasion the GBP has come to this level and held steady even amidst heavy news. Waiting to see where this goes.


GBPJPY Possible Buy Set UpIf you want to keep updated on this trade click the link in my bio and join our FREE signal group!

GBPJPY longGBPJPY was totaly exhausted trying to go further down, so
what I expect from GJ this week is defitinitely uptrend movement.
Important Supply area with daily resistance is important and major area to break.
Daily trendline is also major resistance, which will try to hold GJ in downtrend.
After breaking trendline + resistance area, i will be looking for buy opportunities same
as on USDJPY (on UJ i expect bigger pullback before move up than on GJ)
Don't forget to trade with proper RM/MM and caution.
Good luck traders! Wish ya profitable week

GBPJPY sell breakoutGBPJPY easy setup as you can see on chart
I will be shorthing breakout previous resistance (support now) and
trendline break, which will lead into making new lows
Do not forget to trade with proper RM/MM and caution.
Good luck guys.


GBPJPY buy Looking for price push upwards and respect this tough area. Though it may have closed below the fib levels I expect it to to push upwards

GBPJPY waiting signal for directionWaiting for signal where price is going. Price seems to break the trendline, but it could also be fake. Expecting upward move if price goes above 141.000

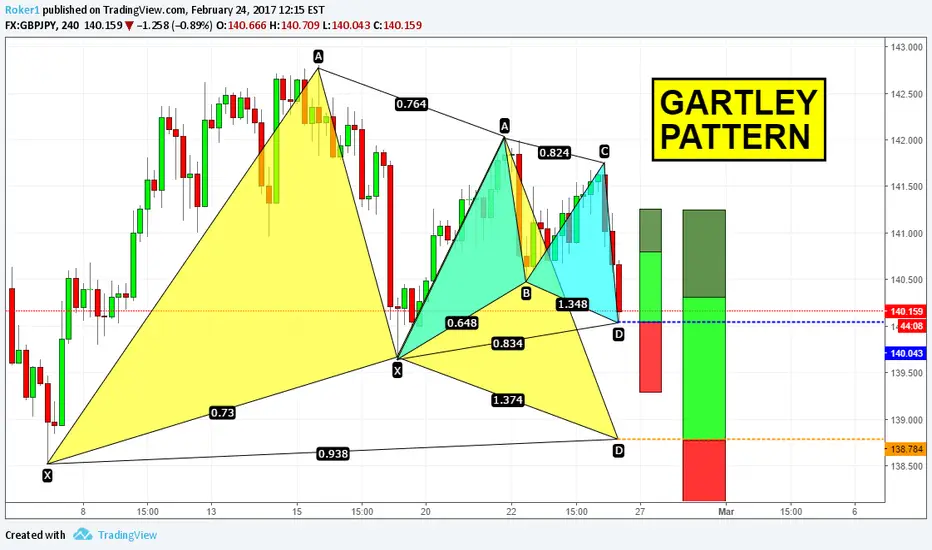
Two Gartley Patterns setting upHey guys,
i want to wish you a nice weekend by offering you these two harmonic patterns (one is almost complete) on GBPJPY.
Stops below X, targets at 382 and 618 retracement of AD leg.
Good trading!
If you want to ask questions, feel free to write them below.
Otherwise, see you in the next chart!

POSSIBLE SCENARIOS FOR GBPJPYTo keep updated on this analisys click the link in my bio and join our FREE signal group

GBPJPY POSSIBLE SCENARIOSTo keep updated on this analisys click the link in my bio and join our FREE signal group!!!

GBPJPY medium term positionThe 50 EMA (red) on 4h seems to be acting as a nice support which has created multiple different support trend lines coming off of many different areas on the chart. A 4h close above 141.50-60 could indicate the start to a 100-150 pip bullish move. If you look at momentum the highest high it made was November 10th 2016, ever since then it has created lower highs. Starting off the high from the 10th of November, momentum has created a solid bearish trend line which it is now trading on the high side of. As long as momentum stays above the -.07875 level we should see market price make a bullish move up to the 143.20 area.

GBP/JPY, DAY CHART, LONG (2-JAN-2017)Note:
Overall, We are bullish on GBP/JPY.
The price correction to 20-EMA followed by a bullish signal.
There are 2 trading plans:
1. Swing Setup, price pullback to 20-EMA followed by
a bullish signal. Can long now with little risk amount.
Or to zoom into H4 or H1 chart, wait for pullback
and bullish signal to long.
2. Wait the price correction to strong support zone at
141.4 level and long again.


Simple trade 0.618 extensionNow Im in short from 140.52 SL 140.77
Pending buy on 133.56
Lets see
Your coment and like welcome! :-)


GBPJPY DOUBLE BOTTOM PATTERN BUY TRADEON THE WEEKLY CHART PRICE HAS TESTED THE 130.008 PRICE LEVEL (PURPLE), TWICE.
PLACE A BUY JUST BEFORE 130.000 LEVEL WITH A STOP LOSS JUST BELOW THAT.
NO PROFIT TARGET. LET YOUR WINNERS RUN.

GBPJPY Bullish Bat382 and 618 targets
2 trades SL on both 134.662 when 382 target hit on trade 1 will move stop to break even on Trade 2
