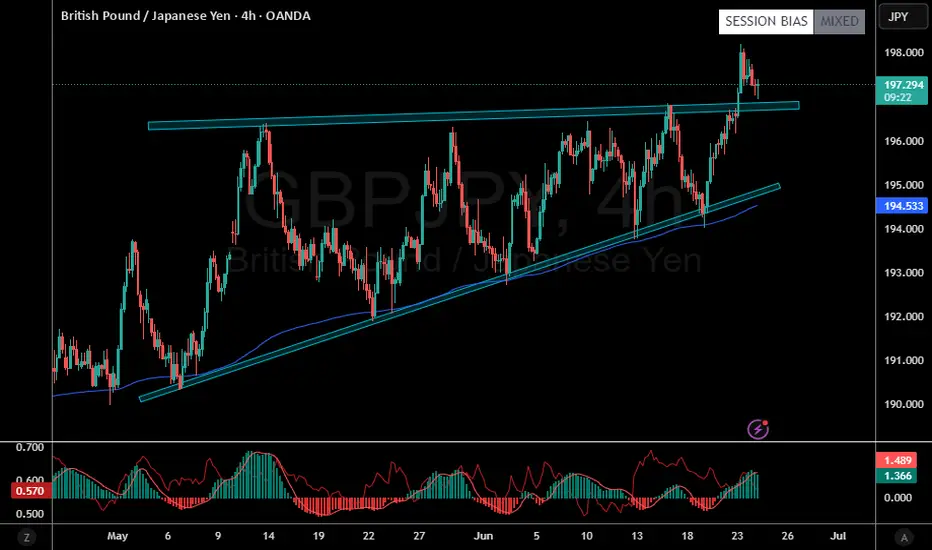
GBPJPY...LONGPrice is nearing a critical level around . No setup, no trade. For me, a solid plan always comes before any prediction.
If the zone is broken and confirmed with a retest, I’ll adjust my plan accordingly for a possible reverse trade.
Gbpjpyforecast

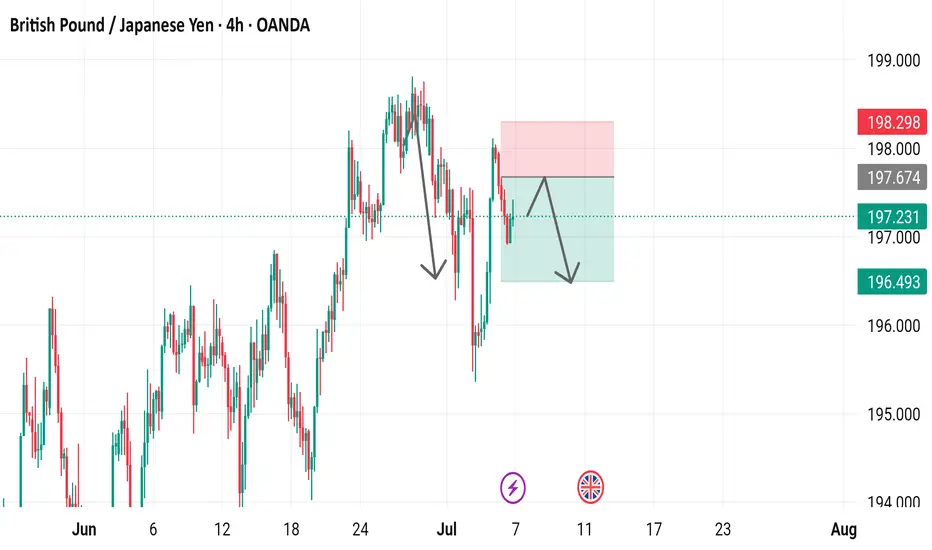
GBP/JPY 4-Hour Chart Analysis - OANDA4-hour chart of the British Pound (GBP) against the Japanese Yen (JPY) from OANDA shows a recent price of 197.231, with a decrease of 0.653 (-0.33%). The chart highlights a sell signal at 197.006 and a buy signal at 197.456, with a 45.0 pip difference. A downward trend is indicated with a shaded resistance zone between 198.298 and 197.674, suggesting potential selling pressure as the price approaches this level. The chart covers data from late June to early July 2025.
GBPJPY: Still BullishPrice has pulled back and is currently reacting to H1 OB at 197.00–197.20
* FVG Support: Between 196.80–197.10
* Watch for: Bullish BOS above 197.50 to confirm buyers stepping back in
* Confirmation Needed: M15 bullish BOS above 197.50–197.60 for buy entry
🟢Entry: 196.80 – 197.10
Stop Loss: 196.4
TP1: 198
TP2: 198.6
TP3: 200
Breakout Option: If price pushes above 198.30 (M15 BOS + retest), you can enter.
❌ Bullish Bias Invalidation
H1 close below 196.40 → signals potential deeper retracement

GBPJPY: Bullish Impulse May Take Price To 205! 700+ Pips MoveGBPJPY is in steady bullish move in other words it is in impulse move; price has not yet exhausted and there is still extended bullish move to completed before bears takes control over. Please use accurate risk management while trading and do your own analysis.
LIKE
COMMENT
SHARE
Good luck.
Team Setupsfx_

GBP/JPY Retests Supply Zone as Yen StrengthensGBP/JPY bounced from 195.3 and is testing resistance at 197.0, where a bearish fair value gap is located.
Stochastic shows rising momentum at 28.0, but institutional data favors the Yen, with increasing long contracts.
If 197.0 holds, the pair may retest 195.3, the previous day's low. The bearish outlook remains valid below the 197.8 resistance.

GBP/JPY) back bullish trend analysis Read The captionSMC trading point update
Technical analysis of GBP/JPY on the 2-hour timeframe, signaling a potential rally from a key support area. Here’s a breakdown of this analysis:
---
Technical Breakdown
1. Key Support Zone (Yellow Box):
Price has pulled back to a strong support level around 196.50–197.00.
This level previously acted as resistance and now flipped to support (classic support-resistance flip), marked by the green arrow.
2. EMA 200 as Dynamic Support:
The 200 EMA (~196.567) is just below the support zone, reinforcing the likelihood of a bullish bounce from this area.
3. Bullish Price Projection:
The chart suggests a bounce off this support zone with a projected move toward the target point at 200.132, indicating a +1.71% upside.
4. RSI Indicator (14):
RSI is at 43.47, approaching the oversold region but curving upward — supporting a potential reversal to the upside.
---
Forecasted Move
Expected Move: Bullish reversal from support, targeting 200.132.
The chart outlines a potential entry at current levels, with a bounce confirmed by price respecting the yellow support zone.
Mr SMC Trading point
---
Trading Idea Summary
Bias: Bullish
Entry Zone: Around 196.50–197.00
Stop-Loss: Below support zone (~196.00 or lower)
Take-Profit: 200.132
Confirmation: Bullish candlestick pattern or RSI crossover
plesse support boost 🚀 this analysis

"GBP/JPY: High-Risk Pips Grab – Escape Before Cops! 🏴☠️ GBP/JPY "Dragon Heist" – Bulletproof Bullish Raid (High-Risk, High-Reward) 🚨
🔥 Attention Market Pirates & Profit Raiders! 🔥
(Day/Swing Trade Plan – Long Entry Focused)
🔑 Entry Zone (Vault Cracked!):
"The Dragon’s loot is unguarded! Bullish pullback = prime stealing opportunity."
Buy Limit Orders: Layer entries near 15M/30M swing lows (wick/body). DCA-friendly!
Thief Pro Tip: Scalpers ride long-only waves. Swing traders? Stack slowly, escape rich.
🎯 Target (Escape Routes):
200.600 (or bail early if cops (resistance) swarm!)
🚨 Red Zone = High-Risk Take-Profit (Overbought? Reversal? Police (bears) lurk here!)
⛔ Stop Loss (Emergency Exit):
4H Swing Low/High (Wick-based) – Adjust for risk/lot size!
No martyr trades! SL = your heist survival kit.
📢 Breaking News (Fundamental Edge):
Dragon’s bullish fuel? Macro data, COT reports, sentiment—CHEK THE LIiNKk 👉🔗 (Don’t skip homework!)
💣 Trading Alerts:
News = Landmines! Avoid new trades during releases.
Trailing SL = Your Getaway Car (Lock profits, dodge volatility.)
💥 Boost This Heist!
Smash 👍, hit 🔔, and fund our next raid! Every boost = more stolen pips for the crew.
Stay tuned—another heist drops soon! 🤑 #ForexBandits

GBP/JPY Trades Lower After Breaching 198.0 SupportGBP/JPY declined from recent highs, currently trading around 197.3. The break below Friday’s 198.0 low intensified the downtrend, with the pair nearing a key support at 196.9.
A temporary rebound toward 198.0 is possible before the downtrend resumes toward 196.0. The bearish outlook is invalidated if GBP/JPY breaks above 198.9.

GBPJPY Eyes 200 BoJ Dovishness & Bullish UK SentimentGBPJPY pair has staged a decisive breakout from a multi-day consolidation zone, with technical momentum and macro fundamentals aligning in favor of further upside. Price action has respected a bullish continuation structure — a falling wedge followed by horizontal accumulation — and is now pressing toward the psychological 200.00 level. With the Bank of England holding firm on policy and the Bank of Japan maintaining its ultra-loose stance, GBPJPY presents one of the strongest carry trade setups in the market. Here's a breakdown of what’s driving this move and what to watch next:
📈 Current Bias: Bullish
The pair has confirmed a bullish breakout above the 198.80–198.95 resistance zone, targeting higher fib extensions at 199.40 and 200.00. Momentum is clearly on the bulls’ side as GBPJPY follows through on a textbook pattern breakout.
🔍 Key Fundamentals:
Bank of Japan’s Dovish Stance: The BoJ continues to resist any significant tightening, reaffirming yield curve control and negative real yields. This keeps the yen fundamentally weak, especially against higher-yielding currencies.
Bank of England’s Hawkish Hold: Despite global easing signals, the BoE remains cautious and data-dependent, with inflation still sticky in the UK. This underpins GBP strength relative to the yen.
Global Risk Appetite: Strong equity markets, especially the US500 rally, reduce demand for the safe-haven JPY and increase appetite for high-yielding cross pairs like GBPJPY.
⚠️ Risks to the Trend:
Safe-Haven Shocks: Any sudden geopolitical tension (e.g., Middle East, US-China trade rhetoric) may trigger JPY demand and reverse the bullish flow.
Unexpected BoE Dovish Pivot: A surprise in UK inflation or dovish commentary from the BoE could weaken GBP momentum.
JPY Intervention Risks: With the yen near historically weak levels, any threat or action from Japan’s Ministry of Finance or verbal intervention by BoJ officials could spark sudden volatility.
📅 Key News/Events Ahead:
Japan’s Tankan Survey (June 30): May influence BoJ tone.
UK Final Manufacturing PMI (July 3): A key gauge for growth momentum.
BoE Governor Bailey Speech (July 5): Any hints on policy trajectory will be market-moving.
US NFP & Global Risk Sentiment: Impacts broader carry trade appetite.
⚖️ Leader or Lagger?
GBPJPY is a leader — it often acts as the flagship pair for carry trade demand. Moves in GBPJPY frequently guide sentiment across other JPY pairs like CADJPY, AUDJPY, and NZDJPY, especially when driven by macro divergences. Its high beta to risk sentiment also makes it a prime barometer for global financial mood.
🎯 Conclusion:
GBPJPY has momentum, macro divergence, and a clean technical setup on its side. The breakout above consolidation favors a continued rally toward 199.40 and possibly 200.00. While geopolitical or policy shocks remain risks, the current backdrop supports staying bullish while above the 197.65 invalidation level.

STEAL THIS TRADE! GBP/JPY Long Setup(Thief Trader’s Secret Plan)💰 Thief Trader’s GBP/JPY Heist Alert – Stealthy Long Setup Loading!
🌍 Greetings, Profit Raiders!
Hola, Konnichiwa, Ni Hao, Privyet, Hallo, Bonjour!
📢 Attention Market Bandits & Chart Pirates—the GBP/JPY Beast is ripe for plunder! Time to execute the next Thief Trader Masterplan.
🎯 Entry Zone – Loot the Dip!
Current price = Open vault. Fire longs now or snipe pullbacks (15M/30M charts recent swing low level).
Pro Thief Move: Stack buy limits near swing lows/highs. Chart alerts = your secret weapon. 🔫
🛑 Stop Loss – Guard the Treasure!
Swing Thieves: Hide SL below 4H swing low (~190.000).
Day Raiders: Adjust SL to your risk size & order count. No free rides!
🎯 Profit Target – Escape with the Gold!
Take the 200.000 bag or exit early if momentum fades.
🔪 Scalpers vs. Swingers – Choose Your Weapon!
Scalpers (Quick Strikes): Longs only. No distractions.
Swing Traders (Patient Hunters): Trail stops & lock in gains.
🌪️ Market Pulse – Bullish Winds Blowing!
Price battling MA Resistance? No panic. Bulls still rule thanks to:
Fundamentals + Macro Trends
COT Data + Sentiment Shift
Quant Scores & Intermarket Alignments
(Check Linkss for the full heist blueprint.)
⚠️ News Trap Warning!
Upcoming high-impact events? Freeze trades or tighten stops. Trailing SL = your escape route.
🚨 Join the Thief Trading Crew!
Like 👍 or Boost 🚀 this idea to fuel our next raid.
Thief Trader Tactics = Daily Market Domination. Your support keeps the heists alive! 💰❤️
🤑 Stay Locked In – The Next Big Score is Coming…
Timing is everything. Watch the charts. Strike hard. Exit smarter.

GBPJPY I Intraday Short from Top of the ChannelWelcome back! Let me know your thoughts in the comments!
** GBPJPY Analysis - Listen to video!

GBPJPY Ascending Triangle Breakout!
HI,Traders !
#GBPJPY is trading in an
Uptrend and the pair is
Now breaking out of the
Ascending Triangle so we
Are bullish biased now
And we will be expecting a
Further move up !
Comment and subscribe to help us grow !

GBPJPY Potentially BullishOANDA:GBPJPY has been on a bullish trajectory and with the current breakout to the upside signifying a potential bullish continuation. With this in mind, I will wait to see a proper re-test around the 196.839 and then see a price action confirmation before taking the trade. Until then, fingers crossed.
#GBPJPY
Disclaimer: Past results does not guarantee future results, do your due diligence.
Pound-Yen Finds Support with Eyes on 198.1FenzoFx—GBP/JPY is forming bullish long-wick candlesticks near 196.8, just above key support at 196.5.
The market remains bullish above this zone, with potential to retest 198.1. A sustained move higher could extend the rally.
The bullish outlook is invalidated if GBP/JPY closes below 196.5.

#GBPJPY: UPDATED VIEW 24/10/2024 **GBPJPY UPDATED VIEW BASED ON PREVIOUS ANALYSIS**
Dear Traders,
I hope you are doing well. Based on our previous analysis of GBPJPY, we identified two potential selling opportunities within the market.
However, the bullish sentiment in the DXY currency pair has had a significant impact on JPY, causing it to fall short of its full value within the daily timeframe. As of today, we have observed a potential exhaustion of DXY’s bullish momentum, with four-hour candles indicating a strong bearish pressure. This development presents an opportunity for JPY to rebound, potentially allowing us to secure substantial profits within the market.
Now, let’s focus on the GBPJPY currency pair. The price has extended its bullish trend, although there is a possibility of a reversal from its current position. We recommend implementing appropriate stop-loss orders for any sell entries taken from the current market price. If the initial entry fails, we are confident that the price is likely to reverse from our second entry.
Before making any decisions based on this analysis, it is essential to conduct your own research. This analysis is solely for educational purposes and should not be considered financial advice.
We appreciate your feedback and support. If you find our work valuable, please consider liking and commenting on our ideas. Additionally, following us will provide us with encouragement and motivation.
Best regards,
Team SetupsFX_

#GBPJPY: 1170+ Massive Sell Opportunity! Get Ready For Big MoveDear Traders,
We have an excellent selling opportunity on GBPJPY, with over 1100+ selling move is likely to occur within next couple of weeks. Please use accurate risk management. For more chart related information read the chart carefully.

GBPJPY: A Big Swing Sell Worth 1500+ pips! Dear Traders,
We have an excellent selling opportunity on GBPJPY with move worth up to 1500 pips! Good luck and like and comment for more!

GBPJPY: Price is trading at crucial level, Possible Swing MoveDear Traders,
GBPJPY, price is currently trading at very crucial area from where we can expect price to reverse, currently the price momentum shows a strong bearish presence. This can be a swing sell after looking at the data, price can touch the previous yearly low.

#GBPJPY: Buyers and Sellers Both Has Equal Chances! Hey there! So, GBPJPY is at a pivotal moment, and we might see a mix of buying and selling activity in the market. Since the bulls aren’t exactly sure what to do next, here’s what we think:
- The GBPJPY pair is having a tough time breaking through the 194 region. The Japanese yen (JPY) is holding steady, making it hard to predict what will happen next. This has made trading JPY pairs a real challenge.
- Looking back at how prices have behaved in similar situations can give us some clues about what might happen in the future. But it’s important to do thorough research before we start trading. Just because something happened in the past doesn’t mean it will happen again.
- The Japanese yen (JPY) also tends to go down when the US dollar (USD) goes up. Since we’re bullish on the DXY index in the coming days, we think the JPY will probably take a hit, and it could go down a lot. It’s also worth keeping an eye on the GBP, which has been one of the most popular currencies since the market opened earlier today.
- In the meantime, we suggest setting two take-profit targets: one at 197 and another at 199. These levels are likely to see a lot of selling activity.
Now, let’s talk about what sellers should do:
- The price is currently in favour of sellers since it dropped from 195.50 to 193.50. And since the last two daily candles closed with strong bearish volume, it looks like the price is going to keep going down.
- If the price breaks below 190.50, that would be a great opportunity for sellers to make some money.
Good luck and trade safely!
Thank you for your unwavering support! 😊
If you’d like to contribute, here are a few ways you can help us:
- Like our ideas
- Comment on our ideas
- Share our ideas
Team Setupsfx_
❤️🚀

#GBPJPY: 600+ Pips Swing Move, JPY To Drop! GBPJPY has successfully rejected the area previously identified in our analysis of GJ. We had anticipated a price rejection and reversal with a strong bullish impulse, which has materialised. Following the positive candle close on Friday, we anticipate a continuation of the bullish trend and potential reaching of the 200 mark.
When trading, it is crucial to prioritise risk management. Conduct your own analysis and utilise this information solely for educational purposes.
Three potential targets have been identified: 198, 200, and 202. A stop loss can be positioned below our buying zone, as indicated by the black-marked zone.
Your support, expressed through likes, comments, and shares, is greatly appreciated and encourages us to continue providing valuable content.
❤️🚀
Team Setupsfx_

GBPJPY and USDJPY Analysis todayHello traders, this is a complete multiple timeframe analysis of this pair. We see could find significant trading opportunities as per analysis upon price action confirmation we may take this trade. Smash the like button if you find value in this analysis and drop a comment if you have any questions or let me know which pair to cover in my next analysis.

GBP/JPY 2-Hour Chart - OANDA2-hour price movement of the British Pound (GBP) against the Japanese Yen (JPY) from OANDA, showing a current value of 196.248 with a slight decrease of 0.256 (-0.13%). The chart includes candlestick patterns, a highlighted resistance zone (pink), and a support zone (cyan), with key levels marked at 197.016, 196.348, 195.002, and 194.000. The time frame spans from June 6 to July 3, 2025.

GBPJPY Hello traders. A new buy opportunity has emerged on the GBPJPY pair. As you may have noticed, the pair has been rallying non-stop for the past few days, and even on the M15 and M30 charts, it hasn’t offered many pullback opportunities for entries. But it seems that opportunity is finally here. I’ve activated the trade and wanted to share it with you as well.
🔍 Trade Details
✔️ Timeframe: 15-Minute
✔️ Risk-to-Reward Ratio: 1:2.78
✔️ Trade Direction: Buy
✔️ Entry Price: 195.732
✔️ Take Profit: 196.145
✔️ Stop Loss: 195.588
🔔 Disclaimer: This is not financial advice. I’m simply sharing a trade I’ve taken based on my personal trading system, strictly for educational and illustrative purposes.
📌 Interested in a systematic, data-driven trading approach?
💡 Follow the page and turn on notifications to stay updated on future trade setups and advanced market insights.
