GBP/JPY POSSIBLE TO SELL.......NOW
AronnoFX will not accept any liability for loss or damage as a result of
reliance on the information contained within this channel including
data, quotes, charts and buy/sell signals
If you like this idea, do not forget to support with a like and follow.
Traders, if you like this idea or have your own opinion about it,
write in the comments. I will be glad.
Gbpjpyidea

GBPJPY Perfect Uptrend Hello Mate
GBPJPY Perfect Uptrend but in trading, there is nothing perfect but there is a good opportunity for long.
Good Luck.
Thank you For your Support.


GBPJPY SwingSell positions will be triggered upon trendline violation. Mind you this is a weekly chart.
*Disclaimer*
This is not financial advice. Forex trading is a risky business. Exercise proper risk management.
#TradeLikeMagnatrio

Trading Idea GBPJPYThis Currency Pair Is Moving in Parallel Channel I am Expecting It to Move Up Till Upward Till Channel Resistance Area

GBP/JPY Full Analysis And New Long Setup To Catch 200 Pips !This is an educational + analytic content that will teach why and how to enter a trade
Make sure you watch the price action closely in each analysis as this is a very important part of our method
Disclaimer : this analysis can change at anytime without notice and it is only for the purpose of assisting traders to make independent investments decisions

GJ going up?Looking at GBP/JPY ANALYSIS from the 1D timeframe, there has been a downtrend in price, which started last week, the decline started
at the levels of 153.275 and now it has reached a support level at 151.295, By this, I can see a potential for a reversal back to
the resistance levels at 153.275
here is a list of things I looked at before taking my direction :
Overrral trend of GJ is an uptrend graph
The decline of price was more of a pullback
The RSI on the timeframe from 4H - 1H is signaling an oversold graph, which means We are looking out for potential reversal signals
The graph has reached the support levels
The channel is uptrending

GBPJPY FINALLY REJECTS RESISTANCE!!!After the sweet profitable uptrend on this pair, we saw price get to a resistance level and stall.
This is a 4-hour and daily resistance. After the stall came consolidation for a while, but now we see price leaving the area with bearish pressure.
We're joining the start of a possible downtrend now and will be looking for trade opportunities as the current level has been violated.
We'll wait for a pullback into the level before taking sells.

SELLGJ is under a strong monthly resistance level. The order flow pointing bearish with GBP bearish with net positions being closed. Price is below a daily resistance level. If I see a bearish shift in Structure, I'll go short In this pair

GBP/JPY POSSIBLE TO BUY........NOW
Hello Traders, here is the full analysis for this pair,
let me know in the comment section below if you have any questions,
the entry will be taken only if all rules of the strategies will be
satisfied. I suggest you keep this pair on your watch list and see if
the rules of your strategy are satisfied.
Dear Traders,
If you like this idea, do not forget to support with a like and follow.

GBPJPY: BEWARE FALSE BREAKOUT SOON.Since last week, Japan has big problem again with Corona Delta variant and very common could delay economic recovery in Japan.
you check on Daily chart of #CoronaVirus cases in Japan.
Just worry it will create false breakout on the chart.
Play safe and wait confirmation and do not rush your trade

GbpJpy- Trade the breakAfter reaching 156 high, GbpJpy started to drop.
The drop is corrective in nature and has stopped in 149-150 very strong support
At this moment the pair is trading around 153 resistance and a break here could lead to acceleration to the upside.
I'm looking to buy for 160 target

GBPJPY AnalysisLooking at the weekly timeframe, GJ has been in a flag correction since the beginning of May, following a very strong impulse from mid March this year. Price has given us 3 touches on our resistance trendline confirm that price is respecting it. price has since fallen off this 3rd touch (as seen on the chart above). We were in a correction phase until price broke out with great momentum (represented by the length of the candles on H1) but was also quick to reverse back into the correction pattern. However, on the H4, its not really final as to what price wants to do. Im waiting for either a daily candle close or H4 close to support my bias. Overall I am anticipating a fall in GJ.
*Disclaimer*
This is not financial advice. Forex trading is a risky business. Trade at your own risk. Patience and risk management are crucial.
#Trade_Like_A_Magnate

GBPJPY top-down analysis Hello traders, this is the full breakdown of this pair. We will take this trade if all the conditions are satisfied as discussed in the analysis. Smash the like button if you find value in this analysis and drop a comment if you have any questions or let me know which pair to cover in my next analysis.


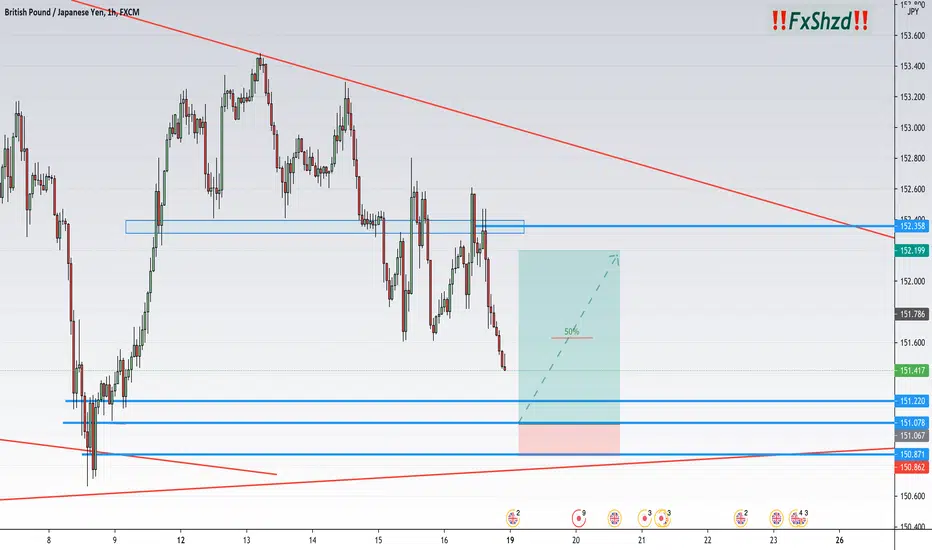
GBPJPY Buy limit Lovely order on GBPJPY R:R 1:6
@FxShzd trading style doesn't care about win rate only thing cares is Risk to Reward
‼️Attention‼️ As soon as we get 50%✅ in profit, SL❌ to entry point
Clear setup
Lets make trading simple W/ @FxShzd

GBPJPY Buy LimitLovely order on GBPJPY R:R 1:5.5
@FxShzd trading style doesn't care about win rate mainly focuses on Risk to Reward
‼️Attention‼️ As soon as we get 50%✅ in profit, SL❌ to entry point
Clear setup
Lets make trading simple W/ @FxShzd
GBP/JPY Running In 130 Pips,New Entry Added To Who Missed FirstThis is an educational + analytic content that will teach why and how to enter a trade
Make sure you watch the price action closely in each analysis as this is a very important part of our method
Disclaimer : this analysis can change at anytime without notice and it is only for the purpose of assisting traders to make independent investments decisions

GBP/JPY Made Inverted Head And Shoulders, Catch Before Takeoff !This is an educational + analytic content that will teach why and how to enter a trade
Make sure you watch the price action closely in each analysis as this is a very important part of our method
Disclaimer : this analysis can change at anytime without notice and it is only for the purpose of assisting traders to make independent investments decisions

GBPJPY Long into 151.300Confluences
A. Potential Head and Shoulder pattern
b. It is in the buy zone
c. Minor Key level
d. FIB 38.2%
e. Rejected the 148.500 Major psychological level

GBPJPY Is Back For the Retest After the Breakout
Welcome back Traders, Investors, and Community!
Hi Traders, GBPJPY on H4 Has broken below a major Resistance and now it’s back for the retest. It’s expected to go lower to 148.1
⬇️Sell now or Sell at 149.57
⭕️SL @ 150.41
✅TP1 @ 148.1
✅TP2 @ 146.5
✅TP3 @ 145.05
We will have more FREE forecasts in TradingView soon
❤️ Your Support is really appreciated!❤️
Have a Profitable Day

GBPJPY Forming Strong Bearing Pattern GBPJPY on the daily time frame we see it's already breakout nicely an umbrella pattern downside in other hands a strong support level. The British pound is getting weaker against the Japanese Yen. We are going to open a short position from the current price.

