Understanding Market Structure: GBPJPY Trendline Support 📊 GBPJPY Technical Analysis — 15-Min Chart (As of July 24, 2025)
Trend Structure & Price Action
The chart shows a clear ascending trendline, connecting higher lows across the last sessions.
Multiple Break of Structure (BOS) points confirm bullish market behavior, with price consistently forming higher highs and higher lows.
The most recent BOS and price rejection from the lower boundary of the cloud band indicate bullish intent is still active.
Indicators Used
Custom Cloud Band (EMA Based 20, 1.5 settings):
Price is oscillating within and around the cloud band.
Recent candles are attempting to reclaim the upper band, suggesting building bullish momentum.
Volume Profile (VRVP) shows strong volume support around the 198.200–198.500 range, aligning with the trendline.
Support & Resistance
Support Zone: 198.200 (trendline confluence + volume shelf)
Immediate Resistance: 198.800–199.000
Major Resistance: 199.400 (next psychological level and prior high)
Forecast & Trade Idea (Educational Purpose)
If price continues to respect the ascending trendline and breaks above the recent local high (~198.750), we could see a bullish breakout toward 199.200+.
A bullish flag or small consolidation above the trendline before breakout is likely, as illustrated by the arrow.
Invalidation occurs if price breaks and closes below the trendline and 198.200, which may trigger a short-term correction.
✅ Conclusion
GBPJPY is currently in a bullish market structure with support from both trendline and volume profile. A clean breakout above 198.800 with volume confirmation could fuel continuation toward 199.200 and beyond. Risk management is crucial — watch for false breakouts or a shift in structure below the rising trendline.
Gbpjpylong

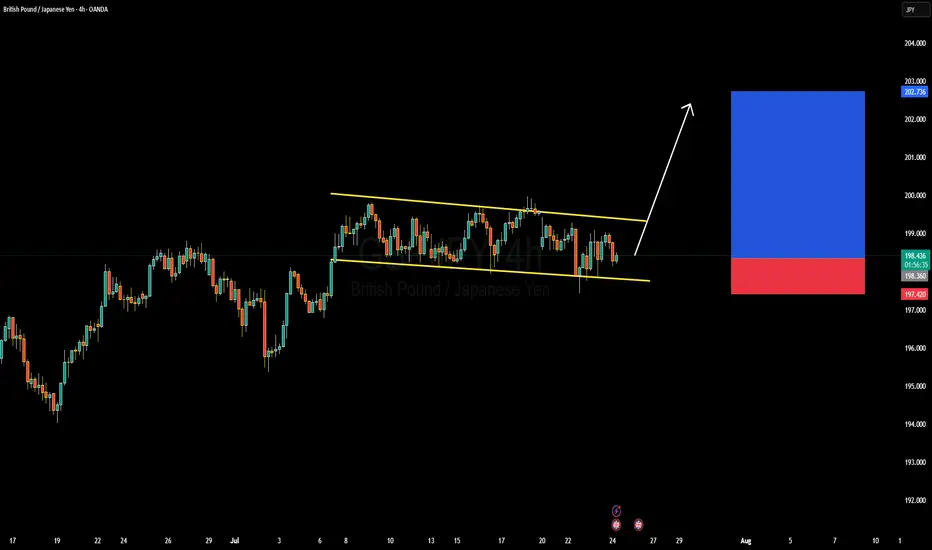
GBPJPY Forming Descending ChannelGBPJPY is currently trading within a well-defined descending channel on the 4H chart, showing signs of building pressure toward an upside breakout. The price has consistently respected both the upper and lower bounds of this channel, creating a controlled correction within a larger bullish trend. With the recent bounce off the lower channel boundary, the pair is now preparing for a potential bullish breakout, aiming for a target zone near 202.700 in the coming sessions.
From a fundamental perspective, the British pound is benefiting from hawkish commentary by the Bank of England, which continues to battle sticky inflation. The latest UK inflation data suggests that price pressures remain elevated, prompting market participants to anticipate further tightening or a prolonged hold in interest rates. On the other hand, the Japanese yen continues to weaken due to the Bank of Japan’s ultra-loose monetary policy, making GBPJPY attractive for long positions amid widening yield differentials.
Technically, the structure remains bullish in the broader context, and this descending channel looks more like a bullish flag—a continuation pattern. If bulls maintain momentum and break above the upper trendline near 199.50, we can expect a strong impulsive move toward the 202–203 zone. The risk remains well-defined below 197.40, which is the recent swing low, giving a healthy risk-to-reward setup for traders.
With strong technical structure and fundamental divergence favoring the British pound over the yen, GBPJPY presents a high-probability long opportunity. I'm looking for confirmation of a breakout on lower timeframes, and once triggered, I expect clean bullish follow-through. Stay ready for the breakout—it’s a textbook setup aligning with macro and technical confluence.
Gbpjpy buy signal. Don't forget about stop-loss.
Write in the comments all your questions and instruments analysis of which you want to see.
Friends, push the like button, write a comment, and share with your mates - that would be the best THANK YOU.
P.S. I personally will open entry if the price will show it according to my strategy.
Always make your analysis before a trade

GBPJPY in Premium Zones of 2008 Financial Crisis - {17/07/2025}Educational Analysis says that GBPJPY (FX pair) may give trend Trading opportunities from this range, according to my technical analysis.
Broker - FXCM
So, my analysis is based on a top-down approach from weekly to trend range to internal trend range.
So my analysis comprises of two structures: 1) Break of structure on weekly range and 2) Trading Range to fill the remaining fair value gap
Will Jpy start to lose value like it is doing since 2019 or it will do free fall same like 2008 crisis.
Let's see what this FX pair brings to the table for us in the future.
Please check the comment section to see how this turned out.
DISCLAIMER:-
This is not an entry signal. THIS IS FOR EDUCATIONAL PURPOSES ONLY.
I HAVE NO CONCERNS WITH YOUR PROFIT OR LOSS,
Happy Trading.

STEAL THIS TRADE! GBP/JPY Long Setup(Thief Trader’s Secret Plan)💰 Thief Trader’s GBP/JPY Heist Alert – Stealthy Long Setup Loading!
🌍 Greetings, Profit Raiders!
Hola, Konnichiwa, Ni Hao, Privyet, Hallo, Bonjour!
📢 Attention Market Bandits & Chart Pirates—the GBP/JPY Beast is ripe for plunder! Time to execute the next Thief Trader Masterplan.
🎯 Entry Zone – Loot the Dip!
Current price = Open vault. Fire longs now or snipe pullbacks (15M/30M charts recent swing low level).
Pro Thief Move: Stack buy limits near swing lows/highs. Chart alerts = your secret weapon. 🔫
🛑 Stop Loss – Guard the Treasure!
Swing Thieves: Hide SL below 2H swing low of candle wick @ (~197.000).
Day Raiders: Adjust SL to your risk size & order count. No free rides!
🎯 Profit Target – Escape with the Cash!
Take the 202.000 bag or exit early if momentum fades.
🔪 Scalpers vs. Swingers – Choose Your Weapon!
Scalpers (Quick Strikes): Longs only. No distractions.
Swing Traders (Patient Hunters): Trail stops & lock in gains.
🌪️ Market Pulse – Bullish Winds Blowing!
Price battling MA Resistance? No panic. Bulls still rule thanks to:
Fundamentals + Macro Trends
COT Data + Sentiment Shift
Quant Scores & Intermarket Alignments
(Check Linnkss for the full heist blueprint.)
⚠️ News Trap Warning!
Upcoming high-impact events? Freeze trades or tighten stops. Trailing SL = your escape route.
🚨 Join the Thief Trading Crew!
Like 👍 or Boost 🚀 this idea to fuel our next raid.
Thief Trader Tactics = Daily Market Domination. Your support keeps the heists alive! 💰❤️
🤑 Stay Locked In – The Next Big Score is Coming…
Timing is everything. Watch the charts. Strike hard. Exit smarter.

"GBP/JPY: High-Risk Pips Grab – Escape Before Cops! 🏴☠️ GBP/JPY "Dragon Heist" – Bulletproof Bullish Raid (High-Risk, High-Reward) 🚨
🔥 Attention Market Pirates & Profit Raiders! 🔥
(Day/Swing Trade Plan – Long Entry Focused)
🔑 Entry Zone (Vault Cracked!):
"The Dragon’s loot is unguarded! Bullish pullback = prime stealing opportunity."
Buy Limit Orders: Layer entries near 15M/30M swing lows (wick/body). DCA-friendly!
Thief Pro Tip: Scalpers ride long-only waves. Swing traders? Stack slowly, escape rich.
🎯 Target (Escape Routes):
200.600 (or bail early if cops (resistance) swarm!)
🚨 Red Zone = High-Risk Take-Profit (Overbought? Reversal? Police (bears) lurk here!)
⛔ Stop Loss (Emergency Exit):
4H Swing Low/High (Wick-based) – Adjust for risk/lot size!
No martyr trades! SL = your heist survival kit.
📢 Breaking News (Fundamental Edge):
Dragon’s bullish fuel? Macro data, COT reports, sentiment—CHEK THE LIiNKk 👉🔗 (Don’t skip homework!)
💣 Trading Alerts:
News = Landmines! Avoid new trades during releases.
Trailing SL = Your Getaway Car (Lock profits, dodge volatility.)
💥 Boost This Heist!
Smash 👍, hit 🔔, and fund our next raid! Every boost = more stolen pips for the crew.
Stay tuned—another heist drops soon! 🤑 #ForexBandits

GBPJPY: Bullish Structure Still IntactGJ created a new HH then turned sideways. More consolidation or a deeper pull back could be seen before the next rally.
Last BOS: Break above 199.70 → confirmed bullish strength
H4 Demand Zone (Pullback): 198.30–198.60
Liquidity Above: Clean pools at 200.30 – 200.70
H1 Key Zone: 198.60–198.90 (H1 OB + unfilled FVG) → currently being tested.
Momentum Trigger: BOS above 199.30 to confirm buyers stepping back in.
M15 Micro-Structure: Slightly bearish (short-term), sweeping liquidity under 198.80.
What to Watch: M15 bullish BOS above 199.10–199.30 for intraday buy confirmation.
🟢Entry Zone 198.30 – 198.60
SL 197.90
TP1 199.70
TP2 200.30
TP3 201.00
❌ Bullish Invalidation
H1 close below 197.90 → bullish bias neutralized, expect deeper retrace into 197.20 – 197.50.

GBPJPY: Still BullishPrice has pulled back and is currently reacting to H1 OB at 197.00–197.20
* FVG Support: Between 196.80–197.10
* Watch for: Bullish BOS above 197.50 to confirm buyers stepping back in
* Confirmation Needed: M15 bullish BOS above 197.50–197.60 for buy entry
🟢Entry: 196.80 – 197.10
Stop Loss: 196.4
TP1: 198
TP2: 198.6
TP3: 200
Breakout Option: If price pushes above 198.30 (M15 BOS + retest), you can enter.
❌ Bullish Bias Invalidation
H1 close below 196.40 → signals potential deeper retracement

GBPJPY Extremely BullishAs described earlier GJ is extremely bullish and wants to target previous swing. current trading at 199.400 and travelling to the 199.857 which is previous swing high. In my yesterday's analysis I have given clue of GJ's being retracing and accumulating and going up again same is showing. We can see a pullback after taking swing high.

GBPJPY...LONGPrice is nearing a critical level around . No setup, no trade. For me, a solid plan always comes before any prediction.
If the zone is broken and confirmed with a retest, I’ll adjust my plan accordingly for a possible reverse trade.

GBPJPY: Bullish Impulse May Take Price To 205! 700+ Pips MoveGBPJPY is in steady bullish move in other words it is in impulse move; price has not yet exhausted and there is still extended bullish move to completed before bears takes control over. Please use accurate risk management while trading and do your own analysis.
LIKE
COMMENT
SHARE
Good luck.
Team Setupsfx_

GBP/JPY Best Place To Buy Very Clear , Let`s Get This 200 Pips !Here is my 4H T.F Chart and if we check we will see that we have a very good support area very near the price now and we have already a good breakout and the price never retest the broken res and new supp so i`m waiting the price to retest it and give me any bullish price action and then we can buy it and targeting from 100 to 200 pips . and if we have a daily closure below my support then this idea will not be valid .

GBPJPY Eyes 200 BoJ Dovishness & Bullish UK SentimentGBPJPY pair has staged a decisive breakout from a multi-day consolidation zone, with technical momentum and macro fundamentals aligning in favor of further upside. Price action has respected a bullish continuation structure — a falling wedge followed by horizontal accumulation — and is now pressing toward the psychological 200.00 level. With the Bank of England holding firm on policy and the Bank of Japan maintaining its ultra-loose stance, GBPJPY presents one of the strongest carry trade setups in the market. Here's a breakdown of what’s driving this move and what to watch next:
📈 Current Bias: Bullish
The pair has confirmed a bullish breakout above the 198.80–198.95 resistance zone, targeting higher fib extensions at 199.40 and 200.00. Momentum is clearly on the bulls’ side as GBPJPY follows through on a textbook pattern breakout.
🔍 Key Fundamentals:
Bank of Japan’s Dovish Stance: The BoJ continues to resist any significant tightening, reaffirming yield curve control and negative real yields. This keeps the yen fundamentally weak, especially against higher-yielding currencies.
Bank of England’s Hawkish Hold: Despite global easing signals, the BoE remains cautious and data-dependent, with inflation still sticky in the UK. This underpins GBP strength relative to the yen.
Global Risk Appetite: Strong equity markets, especially the US500 rally, reduce demand for the safe-haven JPY and increase appetite for high-yielding cross pairs like GBPJPY.
⚠️ Risks to the Trend:
Safe-Haven Shocks: Any sudden geopolitical tension (e.g., Middle East, US-China trade rhetoric) may trigger JPY demand and reverse the bullish flow.
Unexpected BoE Dovish Pivot: A surprise in UK inflation or dovish commentary from the BoE could weaken GBP momentum.
JPY Intervention Risks: With the yen near historically weak levels, any threat or action from Japan’s Ministry of Finance or verbal intervention by BoJ officials could spark sudden volatility.
📅 Key News/Events Ahead:
Japan’s Tankan Survey (June 30): May influence BoJ tone.
UK Final Manufacturing PMI (July 3): A key gauge for growth momentum.
BoE Governor Bailey Speech (July 5): Any hints on policy trajectory will be market-moving.
US NFP & Global Risk Sentiment: Impacts broader carry trade appetite.
⚖️ Leader or Lagger?
GBPJPY is a leader — it often acts as the flagship pair for carry trade demand. Moves in GBPJPY frequently guide sentiment across other JPY pairs like CADJPY, AUDJPY, and NZDJPY, especially when driven by macro divergences. Its high beta to risk sentiment also makes it a prime barometer for global financial mood.
🎯 Conclusion:
GBPJPY has momentum, macro divergence, and a clean technical setup on its side. The breakout above consolidation favors a continued rally toward 199.40 and possibly 200.00. While geopolitical or policy shocks remain risks, the current backdrop supports staying bullish while above the 197.65 invalidation level.

GBPJPY WEEKLY HIGHER TIME FRAME FORECAST Q3 W27 Y25GBPJPY WEEKLY HIGHER TIME FRAME FORECAST Q3 W27 Y25
Professional Risk Managers👋
Welcome back to another FRGNT chart update📈
Diving into some Forex setups using predominantly higher time frame order blocks alongside confirmation breaks of structure.
Let’s see what price action is telling us today! 👀
💡Here are some trade confluences📝
✅Weekly 50EMA Rejection
✅Daily Order block identified
✅1H Order Block identified
🔑 Remember, to participate in trading comes always with a degree of risk, therefore as professional risk managers it remains vital that we stick to our risk management plan as well as our trading strategies.
📈The rest, we leave to the balance of probabilities.
💡Fail to plan. Plan to fail.
🏆It has always been that simple.
❤️Good luck with your trading journey, I shall see you at the very top.
🎯Trade consistent, FRGNT X

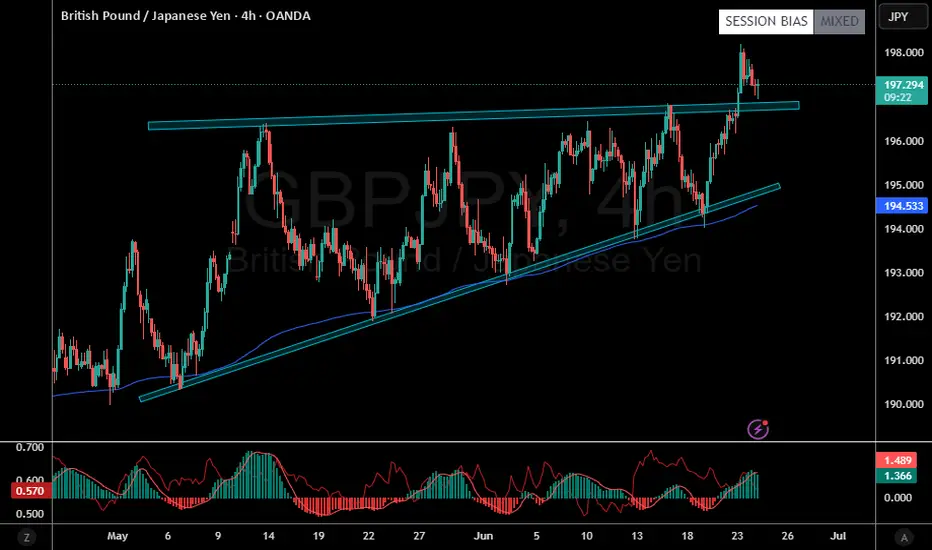
GBPJPY Ascending Triangle Breakout!
HI,Traders !
#GBPJPY is trading in an
Uptrend and the pair is
Now breaking out of the
Ascending Triangle so we
Are bullish biased now
And we will be expecting a
Further move up !
Comment and subscribe to help us grow !

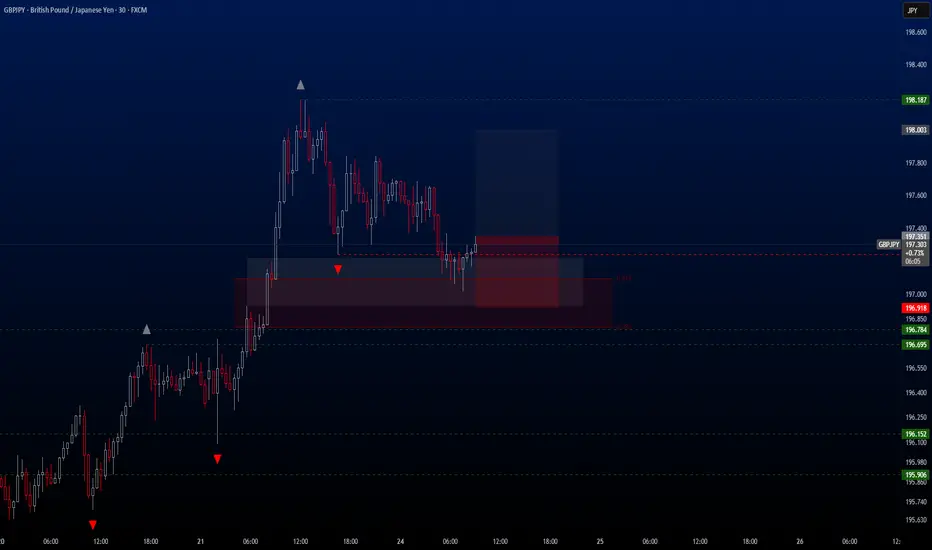
GBPJPY Hello traders.
The first trading opportunity of the day comes from the GBPJPY pair. The bullish scenario on this pair remains intact, and this is largely due to its strong correlation with USDJPY.
For the first time since May 17, USDJPY has climbed back to the 147.00 level, which has triggered momentum across all other JPY-related crosses. GBPJPY is one of the strongest beneficiaries of this movement, and we are now seeing a solid buy setup on the 30-minute chart.
I’ve personally entered the trade and am sharing the full breakdown with you below:
🔍 Trade Details
✔️ Timeframe: 30-Minute
✔️ Risk-to-Reward Ratio: 1:1.50
✔️ Trade Direction: Buy
✔️ Entry Price: 197.351
✔️ Take Profit: 198.003
✔️ Stop Loss: 196.918
🕒 If momentum weakens or the price stalls in a tight range, I will keep this trade open only until 23:00 (UTC+4). After that, I’ll close it manually—whether in profit or loss—depending on how price action evolves.
🔔 Disclaimer: This is not financial advice. I’m simply sharing a trade I’ve taken based on my personal trading system, strictly for educational and illustrative purposes.
📌 Interested in a systematic, data-driven trading approach?
💡 Follow the page and turn on notifications to stay updated on future trade setups and advanced market insights.
GBPJPY Potentially BullishOANDA:GBPJPY has been on a bullish trajectory and with the current breakout to the upside signifying a potential bullish continuation. With this in mind, I will wait to see a proper re-test around the 196.839 and then see a price action confirmation before taking the trade. Until then, fingers crossed.
#GBPJPY
Disclaimer: Past results does not guarantee future results, do your due diligence.
GBPJPY Bullish Move
Monthly Chart
Price respected the Major QP (190.00)
Price also formed a Triple Bottom
The previous monthly candle ended as a bullish engulfing
Short MAs are above Longer MAs and price is above both
Sentiment - Look for buys
Weekly Chart
Price found support at he weekly zone and made a bullish push
Price then sold off (retracement) and respected the 38.2 Fib Level and Minor AQ (192.5) before continuing the bullish trend
The price of the previous candle met resistance at the trend line & sold off but ultimately closed respecting the Minor QP (195.000).
This weeks candle found bullish support and closed bullish engulfing
Sentiment - Look for buys
Daily Chart
Price retraced and found support at the 50.0 Fib Level - confirming bullish trend continuation
Expecting price to continue bullish and test the 0.27 Fib, which also aligns with the Daily Supply Zone & Minor AQ (197.500).
Will look to enter long on lower time frame - 1H/2H
1 Hour Chart
Based on the RSI - a bearish divergence is present signaling some bearish pressure
This algins with the daily TF, as I am looking to enter long after a minor retracement on this timeframe.
Expecting to enter a long position near the 50.0-61.8 Fib area.

GBPJPY Hello traders. A new buy opportunity has emerged on the GBPJPY pair. As you may have noticed, the pair has been rallying non-stop for the past few days, and even on the M15 and M30 charts, it hasn’t offered many pullback opportunities for entries. But it seems that opportunity is finally here. I’ve activated the trade and wanted to share it with you as well.
🔍 Trade Details
✔️ Timeframe: 15-Minute
✔️ Risk-to-Reward Ratio: 1:2.78
✔️ Trade Direction: Buy
✔️ Entry Price: 195.732
✔️ Take Profit: 196.145
✔️ Stop Loss: 195.588
🔔 Disclaimer: This is not financial advice. I’m simply sharing a trade I’ve taken based on my personal trading system, strictly for educational and illustrative purposes.
📌 Interested in a systematic, data-driven trading approach?
💡 Follow the page and turn on notifications to stay updated on future trade setups and advanced market insights.

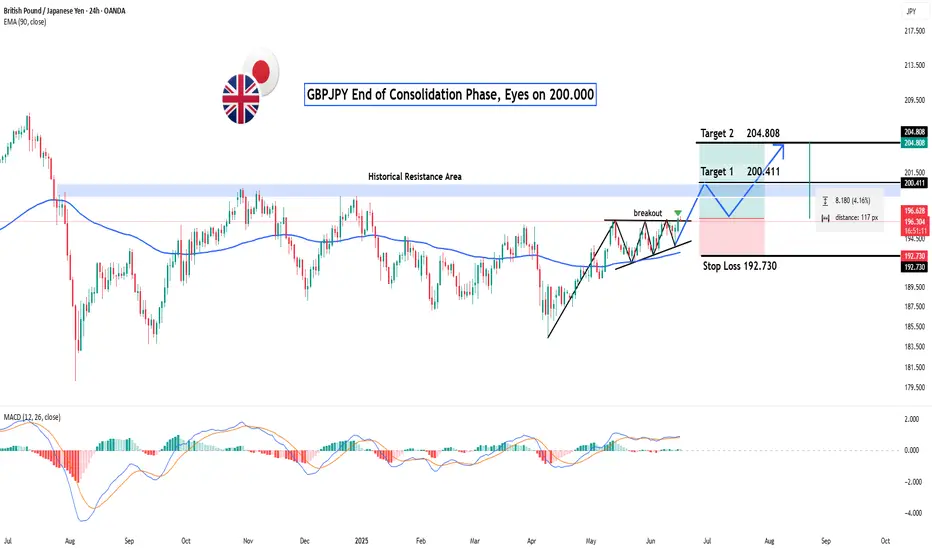
GBPJPY: End of Consolidation Phase, Eyes on 200.000?Hey Realistic Traders!
Could this be the beginning of a major bullish wave ?
Let’s Break It Down..
On the daily timeframe, GBPJPY has formed a Symmetrical Triangle Pattern, followed by a bullish breakout, a classic technical signal that typically marks the end of a consolidation phase and the start of a new bullish trend. This move is further confirmed by the appearance of a strong bullish candlestick, reflecting a surge in buying momentum.
Supporting this bullish scenario, the MACD indicator has also formed a bullish crossover, where the MACD line crosses above the signal line. This crossover is widely regarded as a momentum shift from bearish to bullish, strengthening the case for continued upward movement.
Given these technical signals, the price is likely to advance toward the first target at 200.411, with a potential extension to 204.808.
This bullish outlook remains valid as long as the price holds above the key stop-loss level at 192.730.
Support the channel by engaging with the content, using the rocket button, and sharing your opinions in the comments below.
Disclaimer: "Please note that this analysis is solely for educational purposes and should not be considered a recommendation to take a long or short position on OANDA:GBPJPY ".
GBPJPY LONG & SHORT FORECAST Q2 W25 D19 Y25GBPJPY LONG & SHORT FORECAST Q2 W25 D19 Y25
Professional Risk Managers👋
Welcome back to another FRGNT chart update📈
Diving into some Forex setups using predominantly higher time frame order blocks alongside confirmation breaks of structure.
Let’s see what price action is telling us today!
💡Here are some trade confluences📝
✅Daily order block
✅15' order block
✅Intraday breaks of structure
✅4H Order block
🔑 Remember, to participate in trading comes always with a degree of risk, therefore as professional risk managers it remains vital that we stick to our risk management plan as well as our trading strategies.
📈The rest, we leave to the balance of probabilities.
💡Fail to plan. Plan to fail.
🏆It has always been that simple.
❤️Good luck with your trading journey, I shall see you at the very top.
🎯Trade consistent, FRGNT X

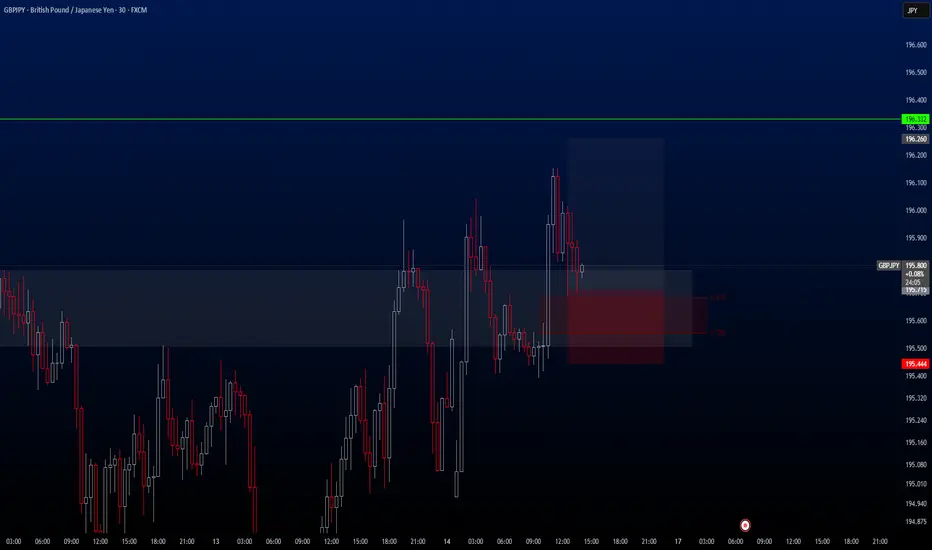
GBPJPY Hello traders.
Today's first trade comes from the GBPJPY pair. The trade is currently active on my side, and I’m happy to share it with you as well.
🔍 Trade Details
✔️ Timeframe: 15-Minute
✔️ Risk-to-Reward Ratio: 1:2
✔️ Trade Direction: Buy
✔️ Entry Price: 195.715
✔️ Take Profit: 196.260
✔️ Stop Loss: 195.444
🔔 Disclaimer: This is not financial advice. I’m simply sharing a trade I’ve taken based on my personal trading system, strictly for educational and illustrative purposes.
📌 Interested in a systematic, data-driven trading approach?
💡 Follow the page and turn on notifications to stay updated on future trade setups and advanced market insights.
GBPJPY - Look for Long (INTRADAY) 1:4.5 and Short (SWING) 1:XXGBPJPY appears to remain in a distribution phase from the supply zone, making its way toward the next demand zone on the higher time frame. We might see a potential sell opportunity during any consolidation before the price continues trending toward the demand area.
Let’s wait and see how price action develops — there’s a chance for entries in both directions, but only if a clear consolidation forms. Otherwise, it’s best to remain patient and look for setups at the next key resistance level.
Disclaimer:
This is simply my personal technical analysis, and you're free to consider it as a reference or disregard it. No obligation! Emphasizing the importance of proper risk management—it can make a significant difference. Wishing you a successful and happy trading experience!
