GBPJPY: Structure Is Still BullishAs explained in the video, my bias is still bullish. HHs and LHs are still being formed. So I am looking to buy GJ as long at 189.97 holds as support. Nice breakout and retest of the falling wedge, which has a bullish FVG and bearish breaker block confluence. I am waiting to see how London looks. Remember we have FOMC tomorrow.
Gbpjpylong

GBP/JPY "The Dragon" Forex Bank Heist Plan (Scalping/Day Trade)🌟Hi! Hola! Ola! Bonjour! Hallo! Marhaba!🌟
Dear Money Makers & Robbers, 🤑 💰💸✈️
Based on 🔥Thief Trading style technical and fundamental analysis🔥, here is our master plan to heist the GBP/JPY "The Dragon" Forex Market. Please adhere to the strategy I've outlined in the chart, which emphasizes long entry. Our aim is to escape near the high-risk MA Zone. Risky level, overbought market, consolidation, trend reversal, trap at the level where traders and bearish robbers are stronger. 🏆💸"Take profit and treat yourself, traders. You deserve it!💪🏆🎉
Entry 📈 : "The vault is wide open! Swipe the Bullish loot at any price - the heist is on!
however I advise to Place buy limit orders within a 15 or 30 minute timeframe nearest or swing low or high level for pullback entries.
Stop Loss 🛑:
📍 Thief SL placed at the recent/swing low level Using the 1H timeframe (188.000) Day/Scalping trade basis.
📍 SL is based on your risk of the trade, lot size and how many multiple orders you have to take.
🏴☠️Target 🎯: 191.000
💰💵💸GBP/JPY "The Beast" Forex Market Heist Plan (Scalping/Day) is currently experiencing a bullishness,., driven by several key factors. 👇👇👇
📰🗞️Get & Read the Fundamental, Macro, COT Report, Quantitative Analysis, Sentimental Outlook, Intermarket Analysis, Future trend targets and Overall outlook score..., go ahead to check 👉👉👉🔗
⚠️Trading Alert : News Releases and Position Management 📰 🗞️ 🚫🚏
As a reminder, news releases can have a significant impact on market prices and volatility. To minimize potential losses and protect your running positions,
we recommend the following:
Avoid taking new trades during news releases
Use trailing stop-loss orders to protect your running positions and lock in profits
💖Supporting our robbery plan 💥Hit the Boost Button💥 will enable us to effortlessly make and steal money 💰💵. Boost the strength of our robbery team. Every day in this market make money with ease by using the Thief Trading Style.🏆💪🤝❤️🎉🚀
I'll see you soon with another heist plan, so stay tuned 🤑🐱👤🤗🤩

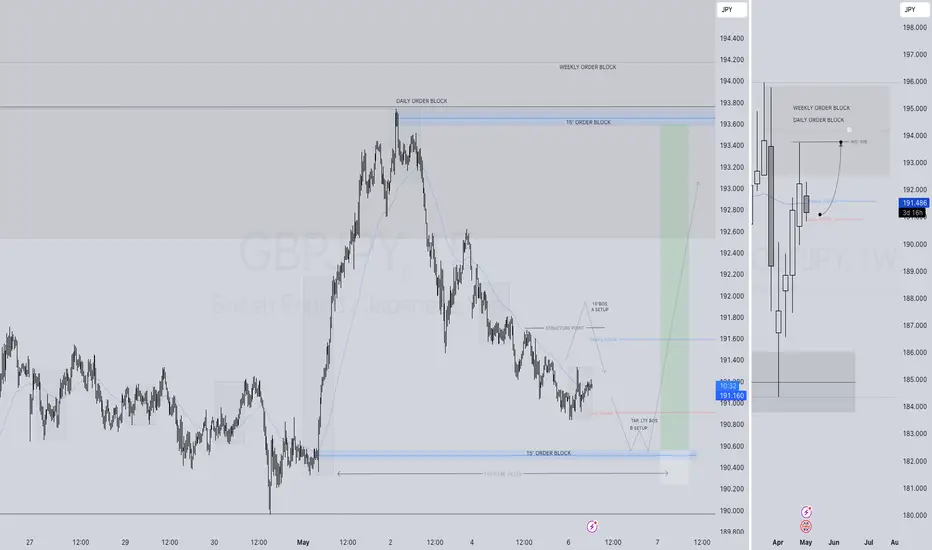
GBPJPY LONG FORECAST Q2 W19 D6 Y25GBPJPY LONG FORECAST Q2 W19 D6 Y25
Professional Risk Managers👋
Welcome back to another FRGNT chart update📈
Diving into some Forex setups using predominantly higher time frame order blocks alongside confirmation breaks of structure.
Let’s see what price action is telling us today!
💡Here are some trade confluences📝
✅Weekly 50 EMA
✅Daily 50 EMA
✅Intraday 15' order block
✅Tokyo ranges to be filled
✅Intraday bullish breaks of structure to be confirmed
🔑 Remember, to participate in trading comes always with a degree of risk, therefore as professional risk managers it remains vital that we stick to our risk management plan as well as our trading strategies.
📈The rest, we leave to the balance of probabilities.
💡Fail to plan. Plan to fail.
🏆It has always been that simple.
❤️Good luck with your trading journey, I shall see you at the very top.
🎯Trade consistent, FRGNT X
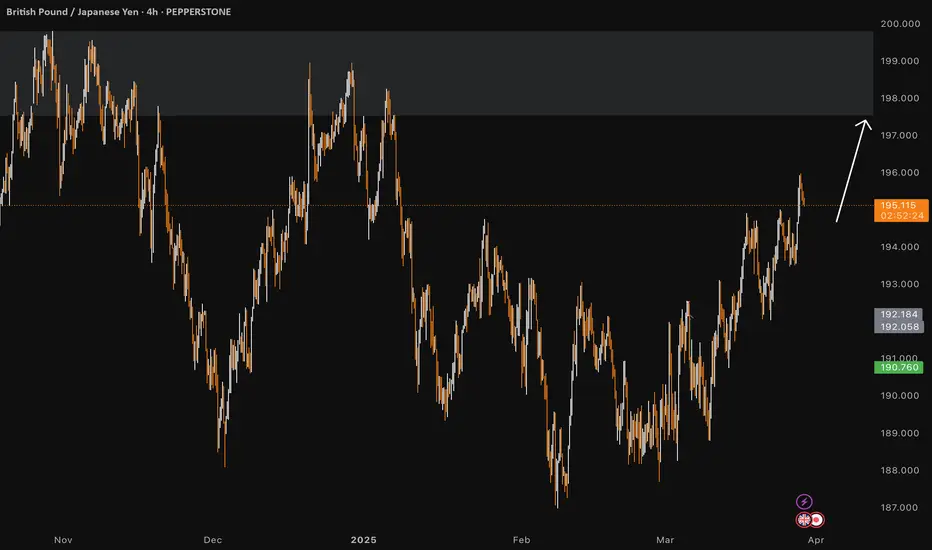
#GBPJPY:Three Positions Currently Opened, What about the next? Our three positions are currently open based on our last three ideas on GJ. We’re witnessing a strong bullish movement at the moment. Our next big target is 197, and then we aim for 200. Remember, trading involves risk, so take your own decisions.
Good luck and trade safely!
Thank you for your unwavering support! 😊
If you’d like to contribute, here are a few ways you can help us:
- Like our ideas
- Comment on our ideas
- Share our ideas
Team Setupsfx_
❤️🚀

GBPJPY Signal : 1H / 4H Beautiful buy !!!Hello Traders! 👋
What are your thoughts on GBPJPY ?
GBPJPY
Market price : 192.40
Buy Limit: 191.20 - 191.00
Tp1 : 192.10
Tp2 : 193.10
Tp3 : 194.50
Tp4 : 195.90
Sl : 190.10 ( 100 pip )
Don’t forget to like and share your thoughts in the comments! ❤️
Remember this is a position that was found by me and it is a personal idea not a financial advice, you are responsible for your loss and gain.

GJ-Thu-1/05/25 TDA-BoJ rate unchanged, clean move up!Analysis done directly on the chart
We will never catch every single move.
It's true sometimes can be frustrating but,
learn to control yourself and not FOMOing
is a psychological skill. We often times
underestimate how important is psychology
in trading!
Not financial advice, DYOR.
Market Flow Strategy
Mister Y

Golden Pattern Alert! Inverse Head & Shoulders Spotted on GBP/JPHi traders! Analyzing GBP/JPY on the 1H timeframe, price is showing signs of a potential bullish reversal with the formation of an Inverse Head and Shoulders pattern:
🔹 Entry: 189.25
🔹 Take Profit (TP): 190.85
🔹 Stop Loss (SL): 188.25
After a strong downtrend, price formed an inverse H&S pattern with the right shoulder completing near the ascending trendline support. A breakout above the neckline around the 189.20 level confirms bullish intent, with momentum supported by a close above both the neckline and the 200 EMA.
RSI is also turning up, showing strengthening bullish momentum. The breakout candle is clean, with volume picking up slightly adding confidence to the setup.
If the pattern plays out fully, the projected target aligns with the upper boundary of the ascending channel around 190.85, which also acts as a confluence zone from previous structure.
⚠️ DISCLAIMER: This is not financial advice. Every trader is responsible for managing their own risk and strategy.

GBPJPY: Are Bulls Ready To Rally?I've already entered a buy. A more conservative entry would be to wait for the descending TL break and retest. Another potential buy entry would be a buy stop around 191.743.
Confirmations:
- Bullish CHoCH
- Creating new HHs and HLs
- Multiple Bullsih FVGs
- Trading above major QP 190
Group Signal:
Entry 191.066
SL 190.5
TP1 191.266
TP2 191.566
TP3 192.066
TP4 193.066

GBP/JPY Bullish Flag (29.04.2025)The GBP/JPY pair on the M30 timeframe presents a Potential Buying Opportunity due to a recent Formation of a Breakout Pattern. This suggests a shift in momentum towards the upside and a higher likelihood of further advances in the coming hours.
Possible Long Trade:
Entry: Consider Entering A Long Position around Trendline Of The Pattern.
Target Levels:
1st Resistance – 192.18
2nd Resistance – 192.70
🎁 Please hit the like button and
🎁 Leave a comment to support for My Post !
Your likes and comments are incredibly motivating and will encourage me to share more analysis with you.
Best Regards, KABHI_TA_TRADING
Thank you.

gbpjpy sell signalIn this analysis, it has exited an ascending channel and entered a descending channel. According to the analysis, if that support floor is crossed and a pullback to that resistance level, that is, the price is 190.829, it is suitable for selling and the stop loss is at 191.87 with a risk to reward of 1 to 5.82.

GBPJPY LONG FORECAST Q2 W18 D28 Y25GBPJPY LONG FORECAST Q2 W18 D28 Y25
Professional Risk Managers👋
Welcome back to another FRGNT chart update📈
Diving into some Forex setups using predominantly higher time frame order blocks alongside confirmation breaks of structure.
Let’s see what price action is telling us today!
💡Here are some trade confluences📝
✅Weekly 50 EMA
✅Daily 50 EMA
✅Intraday 15' order blocks
✅Tokyo ranges to be filled
✅Intraday 15' order block trading levels
🔑 Remember, to participate in trading comes always with a degree of risk, therefore as professional risk managers it remains vital that we stick to our risk management plan as well as our trading strategies.
📈The rest, we leave to the balance of probabilities.
💡Fail to plan. Plan to fail.
🏆It has always been that simple.
❤️Good luck with your trading journey, I shall see you at the very top.
🎯Trade consistent, FRGNT X

GBPJPY Potential longsFX:GBPJPY
After a week of bearish movement, the price has finally broke and closed above last week's high. This pair may give opportunity for some short-term bullish momentum towards the upside. On yesterday's PMI news, price broke above the fib zone and came back retesting, before continuing its second expansion upwards. Price has previously broke above the 4H swap zone but quickly came back to the 1H support zone at 188.24 and retested twice without breaching the support zone. This gives us extra confluence for entering longs.
For swing trading, we can take buys from the second half of the swap zone to the end of the 0.79 fib zone. The reason why we could also enter buys off the 4H swap zone is because price has already retested once on the fib zone, and the swap zone remains as a very strong support. As for intraday and scalping, I’d prefer to wait for short timeframe confirmations and enter with a smaller stop loss for more precise entry. We can target the buys towards 4H resistance zone at 191.180.
Trade safely 😃

#GBPJPY: Will JPY Drop or Continue The Bullish Trend? As JPY strengthens, all ‘XXXJPY’ pairs sold heavily. This trade war scenario is uncertain, so it brings significant risk. If strong news supports the US DOLLAR, we’ll likely see a sharp price drop. Use accurate risk management and analyse before blindly following any advice.
Good luck and trade safely. We wish you the best.
Thanks for your support and love.
Team Setupsfx_

Wed 16th Apr 2025 GBP/JPY Daily Forex Chart Buy SetupGood morning fellow traders. On my Daily Forex charts using the High Probability & Divergence trading methods from my books, I have identified a new trade setup this morning. As usual, you can read my notes on the chart for my thoughts on this setup. The trade being a GBP/JPY Buy. Enjoy the day all. Cheers. Jim

GBPJPY:SIGNALHello dears
Considering the heavy decline we had, you can see that buyers entered with a strong bullish spike, which is a good sign...
Now we can buy in steps on the price pullback and move with it to the specified targets, of course with capital and risk management.
*Trade safely with us*

GBP/JPY "The Beast" Forex Market Heist Plan (Scalping/Day Trade)🌟Hi! Hola! Ola! Bonjour! Hallo! Marhaba!🌟
Dear Money Makers & Robbers, 🤑 💰💸✈️
Based on 🔥Thief Trading style technical and fundamental analysis🔥, here is our master plan to heist the GBP/JPY "The Beast" Forex Market. Please adhere to the strategy I've outlined in the chart, which emphasizes long entry. Our aim is to escape near the high-risk MA Zone. Risky level, overbought market, consolidation, trend reversal, trap at the level where traders and bearish robbers are stronger. 🏆💸"Take profit and treat yourself, traders. You deserve it!💪🏆🎉
Entry 📈 : "The heist is on! Wait for the MA breakout (189.000) then make your move - Bullish profits await!"
however I advise to Place Buy stop orders above the Moving average (or) Place buy limit orders within a 15 or 30 minute timeframe most recent or swing, low or high level for Pullback entries.
📌I strongly advise you to set an "alert (Alarm)" on your chart so you can see when the breakout entry occurs.
Stop Loss 🛑: "🔊 Yo, listen up! 🗣️ If you're lookin' to get in on a buy stop order, don't even think about settin' that stop loss till after the breakout 🚀. You feel me? Now, if you're smart, you'll place that stop loss where I told you to 📍, but if you're a rebel, you can put it wherever you like 🤪 - just don't say I didn't warn you ⚠️. You're playin' with fire 🔥, and it's your risk, not mine 👊."
📍 Thief SL placed at the recent/swing low level Using the 30mins timeframe (186.500) Day trade basis.
📍 SL is based on your risk of the trade, lot size and how many multiple orders you have to take.
🏴☠️Target 🎯: 191.700 (or) Escape Before the Target
🧲Scalpers, take note 👀 : only scalp on the Long side. If you have a lot of money, you can go straight away; if not, you can join swing traders and carry out the robbery plan. Use trailing SL to safeguard your money 💰.
💰💵💸GBP/JPY "The Beast" Forex Market Heist Plan (Scalping/Day) is currently experiencing a bullishness,., driven by several key factors. 👇👇👇
📰🗞️Get & Read the Fundamental, Macro, COT Report, Quantitative Analysis, Sentimental Outlook, Intermarket Analysis, Future trend targets and Overall outlook score..., go ahead to check 👉👉👉🔗
⚠️Trading Alert : News Releases and Position Management 📰 🗞️ 🚫🚏
As a reminder, news releases can have a significant impact on market prices and volatility. To minimize potential losses and protect your running positions,
we recommend the following:
Avoid taking new trades during news releases
Use trailing stop-loss orders to protect your running positions and lock in profits
💖Supporting our robbery plan 💥Hit the Boost Button💥 will enable us to effortlessly make and steal money 💰💵. Boost the strength of our robbery team. Every day in this market make money with ease by using the Thief Trading Style.🏆💪🤝❤️🎉🚀
I'll see you soon with another heist plan, so stay tuned 🤑🐱👤🤗🤩

GBPJPY Discretionary Analysis: Aiming for the Sky I’m not entirely sure, but my gut says it’ll go up. If not, I lose some money and my gut clearly needs more back testing. Profit if I’m right, lesson if I’m wrong! 👌
Just my opinion, not financial advice.
LONG ON GBP/JPYGJ has Taken a dive since last week.
The Jpy Index is now over brought and should begin falling.
This will cause most of the XXX/JPY pairs to rise.
EJ, NJ, and GJ all look great for a buying opp.
GJ has a morning star on the 15min TF, I am waiting for price to pullback to the FVG or demand area on the 15min TF before entering long.
This is a sell limit order risking 65 pips to make over 300 pips.
See you at the top.

GBP/JPY "The Dragon" Forex Bank Bullish Heist Plan🌟Hi! Hola! Ola! Bonjour! Hallo! Marhaba!🌟
Dear Money Makers & Robbers, 🤑 💰💸✈️
Based on 🔥Thief Trading style technical and fundamental analysis🔥, here is our master plan to heist the GBP/JPY "The Dragon" Forex Bank. Please adhere to the strategy I've outlined in the chart, which emphasizes long entry. Our aim is the high-risk Red Zone. Risky level, overbought market, consolidation, trend reversal, trap at the level where traders and bearish robbers are stronger. 🏆💸Book Profits Be wealthy and safe trade.💪🏆🎉
Entry 📈 : "The vault is wide open! Swipe the Bullish loot at any price - the heist is on!
however I advise to Place buy limit orders within a 15 or 30 minute timeframe most recent or swing, low or high level. I Highly recommended you to put alert in your chart.
Stop Loss 🛑:
Thief SL placed at the recent / nearest low level Using the 4H timeframe (190.000) swing trade basis.
SL is based on your risk of the trade, lot size and how many multiple orders you have to take.
🏴☠️Target 🎯: 199.000 (or) Escape Before the Target
🧲Scalpers, take note 👀 : only scalp on the Long side. If you have a lot of money, you can go straight away; if not, you can join swing traders and carry out the robbery plan. Use trailing SL to safeguard your money 💰.
GBP/JPY "The Dragon" Forex Bank Heist Plan (Day Trade) is currently experiencing a bullishness,., driven by several key factors.
📰🗞️Get & Read the Fundamental analysis, Macro Economics, COT Report, Quantitative Analysis, Intermarket Analysis, Sentimental Outlook, Positioning and future trend...
Before start the heist plan read it.👉👉👉
📌Keep in mind that these factors can change rapidly, and it's essential to stay up-to-date with market developments and adjust your analysis accordingly.
⚠️Trading Alert : News Releases and Position Management 📰 🗞️ 🚫🚏
As a reminder, news releases can have a significant impact on market prices and volatility. To minimize potential losses and protect your running positions,
we recommend the following:
Avoid taking new trades during news releases
Use trailing stop-loss orders to protect your running positions and lock in profits
💖Supporting our robbery plan 💥Hit the Boost Button💥 will enable us to effortlessly make and steal money 💰💵. Boost the strength of our robbery team. Every day in this market make money with ease by using the Thief Trading Style.🏆💪🤝❤️🎉🚀
I'll see you soon with another heist plan, so stay tuned 🤑🐱👤🤗🤩

GBPJPY LONG/BUYBy utilizing Fibonacci retracement levels, historical patterns, , we can formulate a hypothesis that the market might follow a similar trajectory if bullish sentiment prevails.

#GBPJPY: +250 Pips From Last Idea Expecting A Strong Bulls! The GBPJPY currency pair experienced a decline to the 190 area, which represents a discounted price range. Subsequently, the price reversed positively by approximately 250 pips. Our market analysis remains unchanged, and we anticipate that the price will continue to exert dominance.
It is possible that the price may experience a correction or a downward movement, as we anticipate the release of strong economic data this week. This data is likely to influence the future trajectory of the currency pair.
We encourage you to like and comment for further insights. Your support has been invaluable throughout our journey, and we sincerely hope that you achieve success in your own market endeavours.
Team Setupsfx_
❤️🚀

GBPJPY: Change in price behaviour, we may see possible upside! Dear Traders,
hope you are doing well, we have an excellent buying opportunity on gbpjpy where we can see price going up around 197 region where we can price see strong sell presence. Good luck and trade safe!

#GBPJPY: 681+ Pips Buying Chance from a Key Level. Dear Traders,
Since the Japanese Yen (JPY) experienced a significant decline in the market, prices have risen. This analysis examines two key areas: the complex bullish price behaviour and the rejection of prices at levels we are currently monitoring for potential entry. While this chart analysis serves as a secondary reference, it should complement your own trading strategies.
Best regards,
Team Setupsfx_
