GBPJPY Pair : GBPJPY ( British Pound / Japanese Yen )
Description :
Consolidation Phase as an Corrective Pattern in Short Time Frame
Break of Structure and Retracement
Triple Top
RSI - Divergence
Completed " 12345 " Impulsive Waves
Gbpjpyprediction

SHORT GBP/JPY from 192.60 (again!!)The area around the WR1 (192.52) pivot both last week and this week has been a bridge to far for GBP/JPY BULLS.
I've shorted this pair 4x this week and we're back at the pivot once more.
Yesterday saw a massive sell off in the early hours and this looked like it was the end for GBP/JPY BULLS but amazingly they've recovered all lost ground and the price is pushing this WR1 level once again.
Although nothing in forex is certain, its recognized that history repeats itself and if SELLERS are waiting for the price to hit a certain level then its likely that they'll jump in again if/once the price reaches that level.
Whilst we a re still waiting for a BEARISH signal on the mid time frames (15m, 30m and H1) the M5 is clearly BEARISH on RSI, MACD and Andean Oscillator and the current H1 candle looks like its going to be a pinbar which would be a BEARISH candle particulalry as this comes at known and proven resistance.
So I'm SHORT again and looking for an intermediate target at 191.97 (WM3 pivot and 200 EMA) but its entirely possible we may see another mass sell off like yesterday once price dips under 192.20 area so if this trade does take off then momentum will determine wheh we can take profit.
It has to be remembered that the persistency of GBP/JPY BULLS means we cannot rule out another attempt by the BULLS to drive the price higher but with 192.62 having been successfully defended 7x over the last 2 weeks its hard to see how this key level can be broken in the absense of further news.
Interesting to note that the GBP Retail Sales came in red (0.0% actual 0.3% exp) which didn't seem to make any lasting difference to the direction this pair was headed from 01:00 this morning so there's clearly still agreat deal of BULLISH sentiment around still.

SELLING GBP/JPY from 1.9268 (again! for the 4th time this week)Pivots are the most significant indicator for how I trade.
I cannot understand why EVERY trader, no matter what their approach is, wouldn't use weekly pivots.
The beauty of pivots is that they are the ONLY indicator that is set at the start of the week so you know where the price is in relation to the pivot days before the price gets there.
This week on GBP/JPY we have seen price hit the WR1 (Weekly Resistance 1 key pivot level) 3 times and I've shorted the pair each time and banked shed loads of pips.
Price is back at WR1 for the 4th time this week and as we KNOW there are SELLERS at this level then SHORTING this pair again is a no-brainer.
No other analysis is really needed though we do have other SHORT confirmations with the red SELL line of the Andean Oscillator rising from 0 on H1 and both RSI and MACD are declining.
The only question is - where do I bank the profit?
The 200 EMA (H1) has been a bridge too far for GBP/JPY BEARS so I'm setting my t.p. at 192.00 though if the momentum is strong and the BEARS are pushing to break thsi key level then 191.31 would be the next target which would be WPP Pivot and this sits above the 200 EMA on H4.
With all that said, this is forex and there are no guarantees and anything can happen.
We could see another drive back to WR1 so we still need to get the position to break even as soon as possible and then if the price does head back north we would look to SHORT from however high the BULLS push the price but I can only see SHORT trades for this pair for the rest of the week.

GBPJPY Higher after JPY fundamentals ChangeWe may observe that GBPJPY has hit it's head several times at 192.803 and has failed to break above this level. All week we've been ranging after moving slightly up early in the week. Price wants to go up and since the Bank of Japan recently increased interest rates for the first time in many years, we may very well anticipate a continued trend on GBPJPY to the upside. This is a rare occasion when buying around the highs has less risk due to the fundamentals. When a market touches a zone and returns this many times, the zone will eventually breakdown. 193.313 Daily zone and monthly zone 193.639 are our bullish targets for GBPJPY. At our monthly zone we may anticipate alot of profit taking and a steep pullback to clear liquidity. Price appears to be forming support at the Daily Level now(192.355) on this thursday NY session, April 18th 24'

SELL GBP/JPY from 192.74I've twice banked pips shorting GBP/JPY from the WR1 pivot this week and as can be seen the price is back at this level.
We have a nice tweezer double top on H1 for the previous 2 candles and as SELLERS are clearly prepared to move into this market from this level, it looka good SHORT opportunity.
However.
The Andean Oscillator is not yet clearly giving a SELL signal.
The green BUY line has slipped under the signal line (.656 signal line/.647 green BUY line) but the red SELL line remains ar zero on H1 although it is above zero on the 15M
MACD on 15m has the fast MA moving beneath the slow which is a BEARISH sign.
RSI has been in high 60's and is gradually declining.
This trade is RISKY!!!
We do not have enough signals to confirm that this pair is headed lower but as we've seen SELLERS enter the market twice this week, the expectation is they may enter again.
It should be noted though that the GBP C.P.I. print came out in green and this has boosted all GBP pairs. This was 4 hours ago however and all BULLISH momentum has stalled.
We have a natural STOP on this trade at 192.86 so its a cheap trade at only 15 pips.
Target is 200 EMA at 191.87 though the price of this pair has been bouncing around all week so the trade will have to be carefully managed in order to maximise any gains.

GBP/JPY makes remarkable recovery, key S/R levelsHello traders, after declining to 190 level, GBP/JPY has staged a remarkable comeback. The support level on the 4Hour chart has held and GBP/JPY is currently up 170 pips from the lows.
So, congrats to all those who managed to buy the dip in GBP/JPY. Currently, the next Resistance level lies at 192.96 level followed by 193.55
Based on the price action, it seems like GBP/JPY will continue to go up. So my strategt would be to buy the dips in GBP/JPY

GBP/JPY at hourly resistance but could move upHello traders, GBP/JPY has been trying to break the hourly resistance at 192.75 but so far, it has not been able to do so. That being said, we are continuously noticing higher lows in the hourly time frame. So, the current price action on GBPJPY is messy.
Although I have been scalp selling GJ every time it reaches 192.75, I feel less confident in selling. In my opinion, it could break out of the hourly resistance and could reach 193.50. So, I recommend traders to be careful with GJ

SHORT GBP/JPY from WR1 pivot 192.65The previous candle on H1 hit GBP/JPY WR1 Pivot and all the signs are that this pair will now reverse.
The rationale for this assumption that GBP/JPY will reverse follows:
a). The current H1 candle is BEARISH.
b). On 15m time frame the RSI declining.
c). The MACD on the same time frame is signalling SHORT.
d). On the Andean Oscillator (15m) we can see that the green BUY line has slipped under the signal line and both are beginning to turn south - this is more apparent on 5M.
e). The red SELL line on the Andean has risen off zero and is climbing.
f). Traders frequently assume price will either sell off at WR1 or BUYERS will enter the market at WS1 (which is why EVERY trader should have pivots on their charts.
Looks a banker SHORT trade this with a tight STOP above WR1 at 192.73
Target is open and depends on momentum but initially the 200 EMA on H1 looks favourite at 191.60 area.

GBPJPY Double Top Pattern Formation ShortWe expect further downside on this pair, signalled by the formation of a double top. We can also see the breakout of a short-term trendline which further supports our directional basis.

GBPJPY: The Japanese yen hits its lowest level in 3 decades amidThe Japanese yen has hit its weakest level against the US dollar since 1990, trading at 153.24 per dollar on April 10. This signals significant downward pressure that has prompted Japanese financial authorities to officially warn of possible intervention. Even though Japan's central bank switched interest rates from negative in March, the currency continues to struggle, with the value of the yen's real effective exchange rate index falling to its lowest level since then. since the records of the Bank for International Settlements began in 1994.
The yen's depreciation has been going on for more than three years, losing about a third of its value since the start of 2021. Factors contributing to the yen's decline include Japan's low interest rates, which remain below 0.1%, in stark contrast to US short-term interest rates at 5.25-5.5%. The significant yield gap between US and Japanese government bonds, with a difference of nearly 370 basis points at the 10-year maturity, has continued to fuel the yen's slide.
Investors have been engaging in "carry trading," borrowing yen at low cost and investing in higher-yielding currencies. This fact is especially appealing during periods of low market volatility, like the present. The benchmark interest rate differential between Japan and other economies is a key driver in these market dynamics.
Despite Japan's central bank's historic policy shift in March, the move was expected. With no prospect of sharp interest rate hikes in the future, investors have felt comfortable maintaining or increasing short positions in the yen. Yen short sales hit a decade high in April.

GBPJPY Technical Analysis and Trade IdeaIn our video, we explore the technical analysis and a trading concept for the GBPJPY. Our assessment indicates a potential trade opportunity. We'll analyze the current price action, closely examine market structure, and factor in market dynamics, and identify a potential entry point guided by favorable conditions. Nonetheless, it's essential to emphasize the importance of sound risk management strategies. Please bear in mind that this video serves purely educational purposes and should not be interpreted as financial counsel.

GBP/JPY 4H chart analysis, bullish move next week?Hello traders, let us take a look at the 4H chart of GBP/JPY.
As you can see, price has respected the dynamic support level( 100 period Moving Average).
In addition, the support zone indicated in the chart is also unbroken.
I feel there is enough bullish momentum for price to reach 193 and beyond. The first
minor resistance would be at 192.25 which if broken will take the price towards
193.50
We are already holding buys from 190.90 level. Recommend traders to load buys
if price dips to the 191 level again

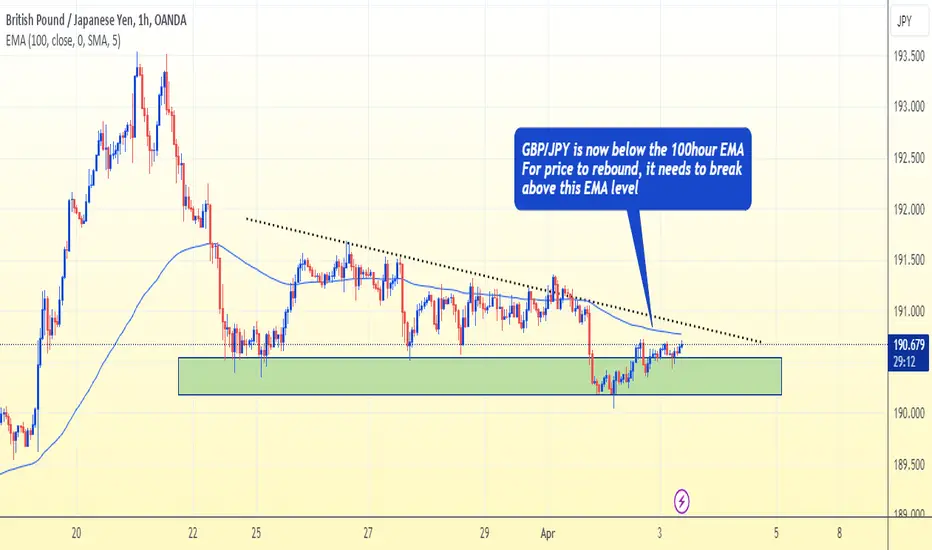
GBP/JPY Key levels for buying +250 Pips potentialHello traders, GBP/JPY has been sliding lower for the last few days. What's even
more interesting if the fact that price has constantly stayed below the 100-hour
moving average for quite some time now.
That being said, there is a possibility of a rebound in GBP/JPY
Traders waiting to buy, must wait for the price to break the 100-hour moving average
level with a strong bullish impulse. Subsequently, the levels to target would be
191.40, 192.26 and 193.60
GBPJPY Analysis (8th April 2024)
Market Analysis PT1/2 (8th April 2024)
GBPJPY Analysis
1 hour timeframe, Price action has created a very bullish push to the upside after retesting the Bullish orderblock, creating another BOS to the upside. In the process, price action has created a bullish FVG on the 1 hour as well.
There are 2 main scenarios i am looking out for later on in the London Session.
1. Price rejects off the fvg and creates a 5 minute Change of Character to continue bullish. Only then will i be interested to look for longs.
2. Price action fails to hold the bullish FVG and retraces deeper into a 1 hour OB. This is where i will be alittle more cautious of buys but its still possible if it gives us a 15 minute bullish Change of Character to show us that the lower timeframe orderflow is shifting bullish.

GBPJPY Top-down analysis Hello traders, this is a complete multiple timeframe analysis of this pair. We see could find significant trading opportunities as per analysis upon price action confirmation we may take this trade. Smash the like button if you find value in this analysis and drop a comment if you have any questions or let me know which pair to cover in my next analysis.

GBPJPY I Potential pullback to support and more growthWelcome back! Let me know your thoughts in the comments!
** GBPJPY Analysis - Listen to video!
We recommend that you keep this pair on your watchlist and enter when the entry criteria of your strategy is met.
Please support this idea with a LIKE and COMMENT if you find it useful and Click "Follow" on our profile if you'd like these trade ideas delivered straight to your email in the future.
Thanks for your continued support!

GBPJPY Bullish Long side Robbery on GJ BankHola Traders,
This is our Day Trade master plan to Heist Bullish side of GBP/JPY BANK . my dear Looters U can enter at the any point above my entered area, Our target is Red Zone that is High risk Caution area, If There is any Bad news it make our heist very sad and if the news is favorable for us then we can continue our looting from there with help of trailing stop.
My dear Robbers please book some partial money it will manage our risk. Be safe and be careful.

GBPJPY 226 Pips05.04.2024
The weekly timeframe doesn't appear strong, but I follow the overall trend. Trading with the higher timeframe trend alone can increase your win rate.
On the daily timeframe, we observed daily liq. low and a rejection of the daily vwap with strong momentum. Therefore, I believe the uptrend will continue, as there are no signs of bearish pressure.
Passive entry module

GBPJPY - Only bullish price action ✅Hello traders!
‼️ This is my perspective on GBPJPY.
Technical analysis: As we can see from PS below price respected my previous analysis and rejected from that zone after filling the imbalance.
For those who missed the entry, can wait for a retracement price to fill the imbalance and then to reject from institutional big figure 191.000.
Like, comment and subscribe to be in touch with my content!

GBPJPY I Bullish breakout and continuation Welcome back! Let me know your thoughts in the comments!
** GBPJPY Analysis - Listen to video!
We recommend that you keep this pair on your watchlist and enter when the entry criteria of your strategy is met.
Please support this idea with a LIKE and COMMENT if you find it useful and Click "Follow" on our profile if you'd like these trade ideas delivered straight to your email in the future.
Thanks for your continued support!

GBPJPY
In the GBP/JPY pair's 4-hour timeframe, a bearish movement is evident as the Elliott Wave analysis suggests completion of the 12345 sequence, indicating a potential correction. Following this, the correction pattern ABC is anticipated. Moreover, with the price having completed around a 38% retracement of the last impulse, further downside movement aligns with a potential downtrend scenario. Traders may monitor key support levels for potential entry points in line with this bearish outlook.

GBPJPY Top-down analysis Hello traders, this is a complete multiple timeframe analysis of this pair. We see could find significant trading opportunities as per analysis upon price action confirmation we may take this trade. Smash the like button if you find value in this analysis and drop a comment if you have any questions or let me know which pair to cover in my next analysis.

GBP/JPY tests key Support, what is the best level to buy?Hello traders, GBP/JPY pulled back 300 pips from the highs at 193.50.
However, the dynamic support level on the 4Hour chart has prevented further declines.
As you can see in the chart, 190.40 level has held well so far. In view of the above,
if price tests the support level again, we would consider buying GBP/JPY@190.40
with Stop Loss placed below 190 and TP at 193.50
