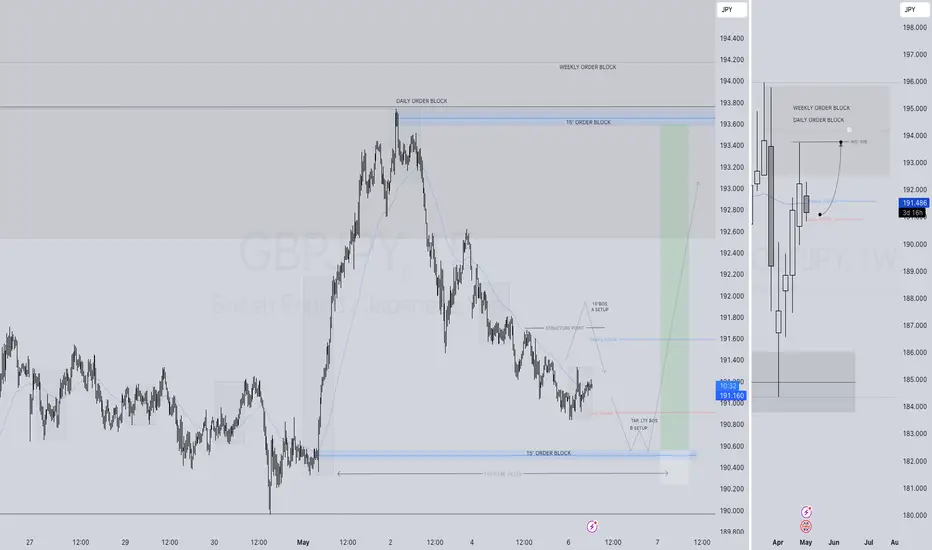
GBPJPY SHORT FORECAST Q2 W20 D16 Y25GBPJPY SHORT FORECAST Q2 W20 D16 Y25
Professional Risk Managers👋
Welcome back to another FRGNT chart update📈
Diving into some Forex setups using predominantly higher time frame order blocks alongside confirmation breaks of structure.
Let’s see what price action is telling us today!
💡Here are some trade confluences📝
✅Weekly order block rejection
✅Daily order block rejection
✅Intraday 15' order blocks
✅Higher time frame bearish structure
🔑 Remember, to participate in trading comes always with a degree of risk, therefore as professional risk managers it remains vital that we stick to our risk management plan as well as our trading strategies.
📈The rest, we leave to the balance of probabilities.
💡Fail to plan. Plan to fail.
🏆It has always been that simple.
❤️Good luck with your trading journey, I shall see you at the very top.
🎯Trade consistent, FRGNT X
Gbpjpyprediction

GBPJPY - Looking To Sell Pullbacks In The Short TermM15 - Bearish divergence followed by the most recent uptrend line breakout.
Lower lows on the moving averages of the MACD.
No opposite signs.
Expecting pullbacks and bearish continuation until the strong resistance zone holds.
If you enjoy this idea, don’t forget to LIKE 👍, FOLLOW ✅, SHARE 🙌, and COMMENT ✍! Drop your thoughts and charts below to keep the discussion going. Your support helps keep this content free and reach more people! 🚀
--------------------------------------------------------------------------------------------------------------------
Disclosure: I am part of Trade Nation's Influencer program and receive a monthly fee for using their TradingView charts in my analysis.

GBPJPY SHORT FORECAST Q2 W20 D14 Y25GBPJPY SHORT FORECAST Q2 W20 D14 Y25
Professional Risk Managers👋
Welcome back to another FRGNT chart update📈
Diving into some Forex setups using predominantly higher time frame order blocks alongside confirmation breaks of structure.
Let’s see what price action is telling us today!
💡Here are some trade confluences📝
✅Weekly order block rejection
✅Daily order block rejection
✅Intraday 15' order blocks
✅Gap fill
🔑 Remember, to participate in trading comes always with a degree of risk, therefore as professional risk managers it remains vital that we stick to our risk management plan as well as our trading strategies.
📈The rest, we leave to the balance of probabilities.
💡Fail to plan. Plan to fail.
🏆It has always been that simple.
❤️Good luck with your trading journey, I shall see you at the very top.
🎯Trade consistent, FRGNT X

GBPJPY SHORT FORECAST Q2 W20 D13 Y25GBPJPY SHORT FORECAST Q2 W20 D13 Y25
Professional Risk Managers👋
Welcome back to another FRGNT chart update📈
Diving into some Forex setups using predominantly higher time frame order blocks alongside confirmation breaks of structure.
Let’s see what price action is telling us today!
💡Here are some trade confluences📝
✅Weekly order block rejection
✅Daily order block rejection
✅Intraday 15' order blocks
✅Gap fill
🔑 Remember, to participate in trading comes always with a degree of risk, therefore as professional risk managers it remains vital that we stick to our risk management plan as well as our trading strategies.
📈The rest, we leave to the balance of probabilities.
💡Fail to plan. Plan to fail.
🏆It has always been that simple.
❤️Good luck with your trading journey, I shall see you at the very top.
🎯Trade consistent, FRGNT X

GBPJPY is Holding above the Support , All Eyes on BuyingHello Traders
In This Chart GBPJPY HOURLY Forex Forecast By FOREX PLANET
today GBPJPY analysis 👆
🟢This Chart includes_ (GBPJPY market update)
🟢What is The Next Opportunity on GBPJPY Market
🟢how to Enter to the Valid Entry With Assurance Profit
This CHART is For Trader's that Want to Improve Their Technical Analysis Skills and Their Trading By Understanding How To Analyze The Market Using Multiple Timeframes and Understanding The Bigger Picture on the Charts

GBPJPY Bullish Breakout – Watch for Momentum Towards 194.60GBPJPY has broken out of a descending wedge and is now retesting the breakout zone near 189.50–189.80. This area aligns with previous structure support and the wedge's upper boundary. Price action indicates bullish momentum is resuming.
🔑 Key Levels:
Current Price: 189.66
Breakout Level: ~189.50
Resistance Targets:
TP1: 190.55 (recent resistance high)
TP2: 192.57
TP3: 194.61 (key supply/weekly resistance zone)
✅ Bullish Confluence:
Breakout from falling wedge pattern
Strong retest of breakout zone with consolidation
Higher low formation and bullish engulfing attempt
No major resistance until 190.50, providing clean upside
🧠 Fundamental Context:
CBI Report (UK): Sentiment and investment outlook among UK manufacturers is deteriorating, but the pound has shown resilience likely driven by broader risk-on market sentiment.
BOJ Outlook (Japan): IMF suggests BOJ is likely to delay further rate hikes due to global uncertainty from US tariffs, maintaining a dovish bias. This weakens the yen’s fundamental strength.
Market Mood: With Japan facing delayed policy tightening and UK's inflation still above target, GBPJPY favors the bullish case in the short term.
💡 Trade Idea:
Bias: Bullish above 189.30
Entry: On retest confirmation around 189.50
Target 1: 190.55
Target 2: 192.57
Target 3: 194.61
Stop Loss: Below 188.80
📌 Note: Keep an eye on US data and BOJ tone shifts. Any risk-off shift in global markets could affect yen strength unexpectedly.

GBPJPY SHORT FORECAST Q2 W19 D9 Y25GBPJPY SHORT FORECAST Q2 W19 D9 Y25
Professional Risk Managers👋
Welcome back to another FRGNT chart update📈
Diving into some Forex setups using predominantly higher time frame order blocks alongside confirmation breaks of structure.
Let’s see what price action is telling us today!
💡Here are some trade confluences📝
✅Weekly order block rejection
✅Daily order block rejection
✅Intraday 15' order blocks
✅Tokyo ranges to be filled
🔑 Remember, to participate in trading comes always with a degree of risk, therefore as professional risk managers it remains vital that we stick to our risk management plan as well as our trading strategies.
📈The rest, we leave to the balance of probabilities.
💡Fail to plan. Plan to fail.
🏆It has always been that simple.
❤️Good luck with your trading journey, I shall see you at the very top.
🎯Trade consistent, FRGNT X

GBPJPY SHORT FORECAST Q2 W19 D8 Y25GBPJPY SHORT FORECAST Q2 W19 D8 Y25
Professional Risk Managers👋
Welcome back to another FRGNT chart update📈
Diving into some Forex setups using predominantly higher time frame order blocks alongside confirmation breaks of structure.
Let’s see what price action is telling us today!
💡Here are some trade confluences📝
✅Weekly order block rejection
✅Daily order block rejection
✅Intraday 15' order blocks
✅Tokyo ranges to be filled
🔑 Remember, to participate in trading comes always with a degree of risk, therefore as professional risk managers it remains vital that we stick to our risk management plan as well as our trading strategies.
📈The rest, we leave to the balance of probabilities.
💡Fail to plan. Plan to fail.
🏆It has always been that simple.
❤️Good luck with your trading journey, I shall see you at the very top.
🎯Trade consistent, FRGNT X

GBPJPYThere’s a buy opportunity on GBPJPY.
This trade setup has three different target levels: 191.467 / 191.759 / 192.181.
You can choose any of these levels as your Take Profit based on your own trading style.
I personally entered the trade at two different price points: 191.020 and 191.139.
Note that the TP and SL levels for these two entries differ.
You can also consider taking this trade and customize your TP/SL levels using the numbers provided.
🔍 Criteria:
✔️ Timeframe: 15M
✔️ Risk-to-Reward Ratio: 1:2 / 1:3.81 / 1:7
✔️ Trade Direction: Buy
✔️ Entry Price: 191.139
✔️ Take Profit: 191.467
✔️ Stop Loss: 190.976
🔔 Disclaimer: This is not financial advice. It's a trade I’m taking based on my own system, shared purely for educational purposes.
📌 If you're also interested in systematic and data-driven trading strategies:
💡 Don’t forget to follow the page and subscribe to stay updated on future analyses.

GBPJPY SHORT FORECAST Q2 W19 D7 Y25GBPJPY SHORT FORECAST Q2 W19 D7 Y25
Professional Risk Managers👋
Welcome back to another FRGNT chart update📈
Diving into some Forex setups using predominantly higher time frame order blocks alongside confirmation breaks of structure.
Let’s see what price action is telling us today!
💡Here are some trade confluences📝
✅Weekly order block rejection
✅Daily order block rejection
✅Intraday 15' order blocks
✅Tokyo ranges to be filled
🔑 Remember, to participate in trading comes always with a degree of risk, therefore as professional risk managers it remains vital that we stick to our risk management plan as well as our trading strategies.
📈The rest, we leave to the balance of probabilities.
💡Fail to plan. Plan to fail.
🏆It has always been that simple.
❤️Good luck with your trading journey, I shall see you at the very top.
🎯Trade consistent, FRGNT X

GBPJPY: Structure Is Still BullishAs explained in the video, my bias is still bullish. HHs and LHs are still being formed. So I am looking to buy GJ as long at 189.97 holds as support. Nice breakout and retest of the falling wedge, which has a bullish FVG and bearish breaker block confluence. I am waiting to see how London looks. Remember we have FOMC tomorrow.

GBP/JPY "The Dragon" Forex Bank Heist Plan (Scalping/Day Trade)🌟Hi! Hola! Ola! Bonjour! Hallo! Marhaba!🌟
Dear Money Makers & Robbers, 🤑 💰💸✈️
Based on 🔥Thief Trading style technical and fundamental analysis🔥, here is our master plan to heist the GBP/JPY "The Dragon" Forex Market. Please adhere to the strategy I've outlined in the chart, which emphasizes long entry. Our aim is to escape near the high-risk MA Zone. Risky level, overbought market, consolidation, trend reversal, trap at the level where traders and bearish robbers are stronger. 🏆💸"Take profit and treat yourself, traders. You deserve it!💪🏆🎉
Entry 📈 : "The vault is wide open! Swipe the Bullish loot at any price - the heist is on!
however I advise to Place buy limit orders within a 15 or 30 minute timeframe nearest or swing low or high level for pullback entries.
Stop Loss 🛑:
📍 Thief SL placed at the recent/swing low level Using the 1H timeframe (188.000) Day/Scalping trade basis.
📍 SL is based on your risk of the trade, lot size and how many multiple orders you have to take.
🏴☠️Target 🎯: 191.000
💰💵💸GBP/JPY "The Beast" Forex Market Heist Plan (Scalping/Day) is currently experiencing a bullishness,., driven by several key factors. 👇👇👇
📰🗞️Get & Read the Fundamental, Macro, COT Report, Quantitative Analysis, Sentimental Outlook, Intermarket Analysis, Future trend targets and Overall outlook score..., go ahead to check 👉👉👉🔗
⚠️Trading Alert : News Releases and Position Management 📰 🗞️ 🚫🚏
As a reminder, news releases can have a significant impact on market prices and volatility. To minimize potential losses and protect your running positions,
we recommend the following:
Avoid taking new trades during news releases
Use trailing stop-loss orders to protect your running positions and lock in profits
💖Supporting our robbery plan 💥Hit the Boost Button💥 will enable us to effortlessly make and steal money 💰💵. Boost the strength of our robbery team. Every day in this market make money with ease by using the Thief Trading Style.🏆💪🤝❤️🎉🚀
I'll see you soon with another heist plan, so stay tuned 🤑🐱👤🤗🤩

GBPJPY LONG FORECAST Q2 W19 D6 Y25GBPJPY LONG FORECAST Q2 W19 D6 Y25
Professional Risk Managers👋
Welcome back to another FRGNT chart update📈
Diving into some Forex setups using predominantly higher time frame order blocks alongside confirmation breaks of structure.
Let’s see what price action is telling us today!
💡Here are some trade confluences📝
✅Weekly 50 EMA
✅Daily 50 EMA
✅Intraday 15' order block
✅Tokyo ranges to be filled
✅Intraday bullish breaks of structure to be confirmed
🔑 Remember, to participate in trading comes always with a degree of risk, therefore as professional risk managers it remains vital that we stick to our risk management plan as well as our trading strategies.
📈The rest, we leave to the balance of probabilities.
💡Fail to plan. Plan to fail.
🏆It has always been that simple.
❤️Good luck with your trading journey, I shall see you at the very top.
🎯Trade consistent, FRGNT X
#GBPJPY:Three Positions Currently Opened, What about the next? Our three positions are currently open based on our last three ideas on GJ. We’re witnessing a strong bullish movement at the moment. Our next big target is 197, and then we aim for 200. Remember, trading involves risk, so take your own decisions.
Good luck and trade safely!
Thank you for your unwavering support! 😊
If you’d like to contribute, here are a few ways you can help us:
- Like our ideas
- Comment on our ideas
- Share our ideas
Team Setupsfx_
❤️🚀

GBPJPY SHORT FORECAST Q2 W19 D5 Y25GBPJPY SHORT FORECAST Q2 W19 D5 Y25
Professional Risk Managers👋
Welcome back to another FRGNT chart update📈
Diving into some Forex setups using predominantly higher time frame order blocks alongside confirmation breaks of structure.
Let’s see what price action is telling us today!
💡Here are some trade confluences📝
✅Weekly order block rejection
✅Daily order block rejection
✅15' order block targets
✅Weekly imbalance fill targets
🔑 Remember, to participate in trading comes always with a degree of risk, therefore as professional risk managers it remains vital that we stick to our risk management plan as well as our trading strategies.
📈The rest, we leave to the balance of probabilities.
💡Fail to plan. Plan to fail.
🏆It has always been that simple.
❤️Good luck with your trading journey, I shall see you at the very top.
🎯Trade consistent, FRGNT X

GBPJPY is Holding above the Support , All Eyes on BuyingHello Traders
In This Chart GBPJPY HOURLY Forex Forecast By FOREX PLANET
today GBPJPY analysis 👆
🟢This Chart includes_ (GBPJPY market update)
🟢What is The Next Opportunity on GBPJPY Market
🟢how to Enter to the Valid Entry With Assurance Profit
This CHART is For Trader's that Want to Improve Their Technical Analysis Skills and Their Trading By Understanding How To Analyze The Market Using Multiple Timeframes and Understanding The Bigger Picture on the Charts

GBPJPY SHORT FORECAST Q2 W18 D2 Y25GBPJPY SHORT FORECAST Q2 W18 D2 Y25
Professional Risk Managers👋
Welcome back to another FRGNT chart update📈
Diving into some Forex setups using predominantly higher time frame order blocks alongside confirmation breaks of structure.
Let’s see what price action is telling us today!
💡Here are some trade confluences📝
✅Weekly order block rejection
✅Daily order block rejection
✅15' order block targets
✅Weekly imbalance fill targets
🔑 Remember, to participate in trading comes always with a degree of risk, therefore as professional risk managers it remains vital that we stick to our risk management plan as well as our trading strategies.
📈The rest, we leave to the balance of probabilities.
💡Fail to plan. Plan to fail.
🏆It has always been that simple.
❤️Good luck with your trading journey, I shall see you at the very top.
🎯Trade consistent, FRGNT X

Golden Pattern Alert! Inverse Head & Shoulders Spotted on GBP/JPHi traders! Analyzing GBP/JPY on the 1H timeframe, price is showing signs of a potential bullish reversal with the formation of an Inverse Head and Shoulders pattern:
🔹 Entry: 189.25
🔹 Take Profit (TP): 190.85
🔹 Stop Loss (SL): 188.25
After a strong downtrend, price formed an inverse H&S pattern with the right shoulder completing near the ascending trendline support. A breakout above the neckline around the 189.20 level confirms bullish intent, with momentum supported by a close above both the neckline and the 200 EMA.
RSI is also turning up, showing strengthening bullish momentum. The breakout candle is clean, with volume picking up slightly adding confidence to the setup.
If the pattern plays out fully, the projected target aligns with the upper boundary of the ascending channel around 190.85, which also acts as a confluence zone from previous structure.
⚠️ DISCLAIMER: This is not financial advice. Every trader is responsible for managing their own risk and strategy.

GBPJPY – Correction Could Offer a Good EntryA few days ago, I mentioned that GBPJPY could rise and test the 195.00 handle – and that idea still stands.
After pushing up to 191.75, the pair began to correct, which might be just what we needed: a chance to enter a long trade at better levels.
Is this correction a healthy pullback before resumption of the up move?
For now, it looks like a typical retracement within an uptrend (bullish flag).
The 190.00 zone, highlighted on the chart, is the ideal spot for long setups.
Why 190.00 is key:
- Strong horizontal support.
- Great risk-reward potential, with over 1:2 R:R possible.
- Price remains in bullish structure above 188.00.
Trading Plan:
Look for bullish confirmation around 190.00 – this zone could provide an excellent buying opportunity.
However, a break below 188.00 would invalidate the setup and call for caution.
Until then, buying the dip remains the plan.
Let the correction finish, and be ready to ride the next wave higher.
Disclosure: I am part of Trade Nation's Influencer program and receive a monthly fee for using their TradingView charts in my analyses and educational articles.

gbpjpy sell signalIn this analysis, it has exited an ascending channel and entered a descending channel. According to the analysis, if that support floor is crossed and a pullback to that resistance level, that is, the price is 190.829, it is suitable for selling and the stop loss is at 191.87 with a risk to reward of 1 to 5.82.

GBPJPY Reclaims 190 – Ready for 195?After breaking below the 188.00 support zone and testing 184.50 support, GBPJPY quickly reversed, signaling strong buying interest and a classic false breakdown.
Last week, the pair also reclaimed the key 190.00 level – an important technical and psychological area – showing clear strength and readiness for a potential continuation higher.
The key question now: Is GBPJPY ready to launch towards new highs?
Here’s why I stay bullish:
- Strong rejection at 184.50 confirms buyer dominance.
- Recovery above 190.00 is a major bullish signal.
- Market structure now favors buying dips
T rading Plan:
I’m looking to buy dips, staying bullish as long as 187.00 remains intact.
🎯 Targeting a move towards 195.00.
Disclosure: I am part of Trade Nation's Influencer program and receive a monthly fee for using their TradingView charts in my analyses and educational articles.

GBP/JPY TRADE ALERT!
GBP/JPY TRADE ALERT!
Potential Trend Reversal Ahead!
Current External Trend: BULLISH
Do you agree with our Daily Time Frame Forecast?
Market has given a CIDS (Candlestick Inside Day Setup), we'll enter after retesting CIDS.
Get ready to trade!
Potential Trend Reversal Ahead!
Current External Trend: BULLISH
Do you agree with our Daily Time Frame Forecast?
Market has given a CIDS (Candlestick Inside Day Setup), we'll enter after retesting CIDS.
Get ready to trade!

GBP/JPY Bearish Reversal Setup–Eyeing Breakdown from Supply Zone1. Supply Zone (Resistance Area) 🟦 Supply Zone:
Located around 189.500–190.000
🔺 Price got rejected here multiple times — strong selling pressure.
2. Ascending Trendline Support
📈 Trendline connecting higher lows (marked with yellow dots)
🟡 Support tested multiple times, acting as a rising wedge structure.
3. EMA (7) — Exponential Moving Average
⚫️ EMA (black line) is currently near price — indicating short-term trend stalling.
4. Bearish Breakout Setup
🔻 Anticipated price drop shown with red/orange arrows
📉 If price breaks below trendline:
🎯 Target Point: 186.600
⬇️ Expected drop: ~1.51%
5. Price Movement Outlook
🔁 Possible minor pullback before breakdown
⛔️ Bearish signal increases if the trendline fails.
Summary (with emojis):
📍 Entry Idea: Short near resistance zone (189.500–190.000)
⛓ Trigger: Break of trendline support
🎯 Target: 186.600
⚠️ Stop-loss: Above 190.000 (above supply zone)
