GBPJPY LONG FORECAST Q2 W16 D16 Y25GBPJPY LONG FORECAST Q2 W16 D16 Y25
Key- to await price to show its play.
The longer term retrace is of course the set that FRGNT would potentially call an A - set up, higher time frame order block long, lower time frame breaks, you know the drill. BUT what if price action does not match your forecast. We must adapt if the position makes sense.
Let's see if GBP has the legs to break 15' structure in London.
We are interested.
One thing is for sure, GJ moves and we endeavour to be part of those dances!
-15' break of structure first prior immediate long.
Trade well!
FRGNT X
Gbpjpyprediction

GBP/JPY) Bearish analysis Read The ChaptianSMC Trading point update
GBP/JPY 2-hour chart outlines a clear bearish setup within a well-defined downtrend. Here's a breakdown of the trading idea:
---
Technical Overview:
Downtrend Channel:
The pair is respecting a downward-sloping channel, with repeated rejections at the upper boundary, confirming bearish control.
Resistance Zone (~187.8 - 188.5):
Price has reached a highlighted resistance area that aligns with previous swing highs and trendline resistance — marked with red arrows for prior rejections.
Bearish Projection:
The analysis anticipates a rejection from this resistance zone followed by a downward impulse move. A pullback is expected, but continuation toward the target support zone around 179.150 is likely.
Target Zone (~179.150):
This level lines up with previous price action and matches the measured move (blue vertical box), adding confluence.
EMA 200 (around 190.36):
Price is well below the 200 EMA, reinforcing the bearish structure and trend bias.
RSI Indicator (~52):
RSI is slightly above 50 but not bullish — this neutral reading suggests the pair has room to drop if resistance holds.
Mr SMC Trading point
---
Trading Idea Summary:
Bias: Bearish
Entry Zone: 187.8 – 188.5 (resistance)
Confirmation: Bearish candlestick pattern or rejection signal
Target: 179.150
Invalidation: Break and close above 190.365 (above EMA 200 and prior highs)
---
plase support boost 🚀 analysis follow)

GBP/JPY "The Beast" Forex Market Heist Plan (Scalping/Day Trade)🌟Hi! Hola! Ola! Bonjour! Hallo! Marhaba!🌟
Dear Money Makers & Robbers, 🤑 💰💸✈️
Based on 🔥Thief Trading style technical and fundamental analysis🔥, here is our master plan to heist the GBP/JPY "The Beast" Forex Market. Please adhere to the strategy I've outlined in the chart, which emphasizes long entry. Our aim is to escape near the high-risk MA Zone. Risky level, overbought market, consolidation, trend reversal, trap at the level where traders and bearish robbers are stronger. 🏆💸"Take profit and treat yourself, traders. You deserve it!💪🏆🎉
Entry 📈 : "The heist is on! Wait for the MA breakout (189.000) then make your move - Bullish profits await!"
however I advise to Place Buy stop orders above the Moving average (or) Place buy limit orders within a 15 or 30 minute timeframe most recent or swing, low or high level for Pullback entries.
📌I strongly advise you to set an "alert (Alarm)" on your chart so you can see when the breakout entry occurs.
Stop Loss 🛑: "🔊 Yo, listen up! 🗣️ If you're lookin' to get in on a buy stop order, don't even think about settin' that stop loss till after the breakout 🚀. You feel me? Now, if you're smart, you'll place that stop loss where I told you to 📍, but if you're a rebel, you can put it wherever you like 🤪 - just don't say I didn't warn you ⚠️. You're playin' with fire 🔥, and it's your risk, not mine 👊."
📍 Thief SL placed at the recent/swing low level Using the 30mins timeframe (186.500) Day trade basis.
📍 SL is based on your risk of the trade, lot size and how many multiple orders you have to take.
🏴☠️Target 🎯: 191.700 (or) Escape Before the Target
🧲Scalpers, take note 👀 : only scalp on the Long side. If you have a lot of money, you can go straight away; if not, you can join swing traders and carry out the robbery plan. Use trailing SL to safeguard your money 💰.
💰💵💸GBP/JPY "The Beast" Forex Market Heist Plan (Scalping/Day) is currently experiencing a bullishness,., driven by several key factors. 👇👇👇
📰🗞️Get & Read the Fundamental, Macro, COT Report, Quantitative Analysis, Sentimental Outlook, Intermarket Analysis, Future trend targets and Overall outlook score..., go ahead to check 👉👉👉🔗
⚠️Trading Alert : News Releases and Position Management 📰 🗞️ 🚫🚏
As a reminder, news releases can have a significant impact on market prices and volatility. To minimize potential losses and protect your running positions,
we recommend the following:
Avoid taking new trades during news releases
Use trailing stop-loss orders to protect your running positions and lock in profits
💖Supporting our robbery plan 💥Hit the Boost Button💥 will enable us to effortlessly make and steal money 💰💵. Boost the strength of our robbery team. Every day in this market make money with ease by using the Thief Trading Style.🏆💪🤝❤️🎉🚀
I'll see you soon with another heist plan, so stay tuned 🤑🐱👤🤗🤩

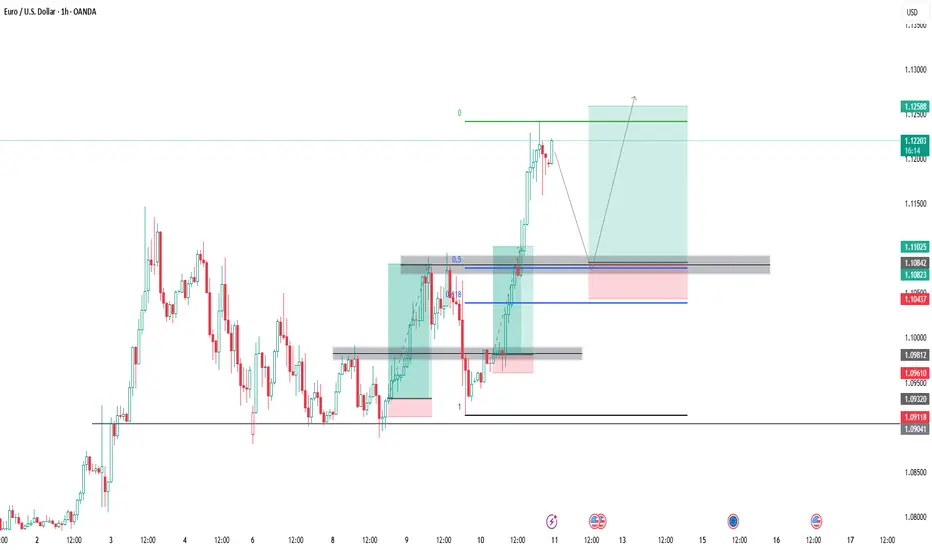
EUR USD Buy Continuation Trade SetupEUR USD has been very bullish so we keep looking for buying opportunities
Here is my idea on EU, bullish structure has been broken now lets wait for a retest then buy along with the trend, the retest level also align with the 0.50 - 0.618 Fib Retracement level
GBPJPY: From Oversold Bounce to Potential DowntrendFenzoFx—The GBP/JPY currency pair bounced from 184.42 due to RSI 14 being oversold. As of now, it trades near 187.7, having erased 1.0% of recent gains.
The trend remains bearish with prices below the 50-period simple moving average and the 50.0% Fibonacci resistance level at 190.2. Support is at 187.0, and a drop below this could target 184.42.
The Bullish Scenario
However, if GBP/JPY surpasses 190.2, bullish momentum may extend to 192.0.
Enter our Forex Analysis Contest to win a prize pool of $160.0 every week >>> FenzoFx Decentralized Forex Broker

A possible bearish movement GBPJPY has been on a bullish run for sometime, currently there is some sell opportunity. lets look if its a bearish movement or just a retracement

GBP/JPY "The Dragon" Forex Bank Bullish Heist Plan🌟Hi! Hola! Ola! Bonjour! Hallo! Marhaba!🌟
Dear Money Makers & Robbers, 🤑 💰💸✈️
Based on 🔥Thief Trading style technical and fundamental analysis🔥, here is our master plan to heist the GBP/JPY "The Dragon" Forex Bank. Please adhere to the strategy I've outlined in the chart, which emphasizes long entry. Our aim is the high-risk Red Zone. Risky level, overbought market, consolidation, trend reversal, trap at the level where traders and bearish robbers are stronger. 🏆💸Book Profits Be wealthy and safe trade.💪🏆🎉
Entry 📈 : "The vault is wide open! Swipe the Bullish loot at any price - the heist is on!
however I advise to Place buy limit orders within a 15 or 30 minute timeframe most recent or swing, low or high level. I Highly recommended you to put alert in your chart.
Stop Loss 🛑:
Thief SL placed at the recent / nearest low level Using the 4H timeframe (190.000) swing trade basis.
SL is based on your risk of the trade, lot size and how many multiple orders you have to take.
🏴☠️Target 🎯: 199.000 (or) Escape Before the Target
🧲Scalpers, take note 👀 : only scalp on the Long side. If you have a lot of money, you can go straight away; if not, you can join swing traders and carry out the robbery plan. Use trailing SL to safeguard your money 💰.
GBP/JPY "The Dragon" Forex Bank Heist Plan (Day Trade) is currently experiencing a bullishness,., driven by several key factors.
📰🗞️Get & Read the Fundamental analysis, Macro Economics, COT Report, Quantitative Analysis, Intermarket Analysis, Sentimental Outlook, Positioning and future trend...
Before start the heist plan read it.👉👉👉
📌Keep in mind that these factors can change rapidly, and it's essential to stay up-to-date with market developments and adjust your analysis accordingly.
⚠️Trading Alert : News Releases and Position Management 📰 🗞️ 🚫🚏
As a reminder, news releases can have a significant impact on market prices and volatility. To minimize potential losses and protect your running positions,
we recommend the following:
Avoid taking new trades during news releases
Use trailing stop-loss orders to protect your running positions and lock in profits
💖Supporting our robbery plan 💥Hit the Boost Button💥 will enable us to effortlessly make and steal money 💰💵. Boost the strength of our robbery team. Every day in this market make money with ease by using the Thief Trading Style.🏆💪🤝❤️🎉🚀
I'll see you soon with another heist plan, so stay tuned 🤑🐱👤🤗🤩

GBP/JPY "The Dragon" Forex Bank Bullish Heist Plan(Scalping/Day)🌟Hi! Hola! Ola! Bonjour! Hallo! Marhaba!🌟
Dear Money Makers & Thieves, 🤑 💰🐱👤✈️
Based on 🔥Thief Trading style technical and fundamental analysis🔥, here is our master plan to heist the GBP/JPY "The Dragon" Forex Bank. Please adhere to the strategy I've outlined in the chart, which emphasizes long entry. Our aim is the high-risk Red MA Level. Risky level, overbought market, consolidation, trend reversal, trap at the level where traders and bearish robbers are stronger. 🏆💸"Take profit and treat yourself, traders. You deserve it!💪🏆🎉
Entry 📈 : "The vault is wide open! Swipe the Bullish loot at any price - the heist is on!
however I advise to Place buy limit orders within a 15 or 30 minute timeframe most nearest or swing, low or high level.
Stop Loss 🛑:
📌Thief SL placed at the nearest/swing low or high level Using the 4H timeframe (192.000) Day/scalping trade basis.
📌SL is based on your risk of the trade, lot size and how many multiple orders you have to take.
🏴☠️Target 🎯: 198.000 (or) Escape Before the Target
🧲Scalpers, take note 👀 : only scalp on the Long side. If you have a lot of money, you can go straight away; if not, you can join swing traders and carry out the robbery plan. Use trailing SL to safeguard your money 💰.
GBP/JPY "The Dragon" Forex Bank Heist Plan (Day / Swing Trade) is currently experiencing a bullishness,., driven by several key factors.👇
📰🗞️Get & Read the Fundamental analysis, Macro Economics, COT Report, Quantitative Analysis, Intermarket Analysis, Sentimental Outlook, Positioning and future trend target...
Before start the heist plan read it...go ahead to check 👉👉👉🔗
⚠️Trading Alert : News Releases and Position Management 📰 🗞️ 🚫🚏
As a reminder, news releases can have a significant impact on market prices and volatility. To minimize potential losses and protect your running positions,
we recommend the following:
Avoid taking new trades during news releases
Use trailing stop-loss orders to protect your running positions and lock in profits
💖Supporting our robbery plan 💥Hit the Boost Button💥 will enable us to effortlessly make and steal money 💰💵. Boost the strength of our robbery team. Every day in this market make money with ease by using the Thief Trading Style.🏆💪🤝❤️🎉🚀
I'll see you soon with another heist plan, so stay tuned 🤑🐱👤🤗🤩

GBPJPY LONG/BUYBy utilizing Fibonacci retracement levels, historical patterns, , we can formulate a hypothesis that the market might follow a similar trajectory if bullish sentiment prevails.

GBPJPY bullish reversal in play. Long from support!Hey traders,
GBPJPY has hit a key support zone, and I’m anticipating a strong bounce from this level. A powerful bullish engulfing candle has just formed on the 4-hour timeframe, swallowing the last three candles—a clear sign of buying pressure!
💡 Trading Idea:
🔹 Entry: Long from 192.90
🔹 Target 1: 193.935
🔹 Target 2: 195.959 (Major resistance)
🔹 Stop Loss: 191.998 (In case support fails)
⚠️ Remember to stick to your trading plan and manage your risk accordingly. This setup presents a great opportunity, but always trade responsibly!
🔥 If you find this idea useful, give it a boost—your support is greatly appreciated! 🚀

GBP/JPY Technical Analysis: Bearish Rejection at Key Resistance?This chart represents a GBP/JPY (British Pound / Japanese Yen) 30-minute timeframe analysis. Here are the key takeaways:
Technical Indicators & Levels
Exponential Moving Averages (EMAs)
200 EMA (Blue Line): 193.586 – A long-term trend indicator.
30 EMA (Red Line): 193.182 – A short-term trend indicator.
Key Levels
Resistance Zone (Stop Loss Level): 193.968
Support/Target Zone: 191.628
Current Price: 193.255 (as per the last recorded candle)
Trade Setup & Market Structure
Bearish Outlook (Sell Scenario)
The price is approaching a strong resistance zone (193.968), which aligns with the 200 EMA.
The price might reject this level and drop toward the target area of 191.628 (approx. 1.00% downside).
The drawn price path suggests a possible retest of resistance before a bearish move.
Bullish Reversal (Invalidation of Bearish Setup)
If the price breaks and holds above 193.968, it could invalidate the bearish setup and push higher.
A sustained move above the 200 EMA may indicate a trend shift to bullish.
Conclusion
Bearish bias as long as the price stays below 193.968.
A possible short trade opportunity if resistance holds, targeting 191.628.
Caution: If price breaks above resistance, it could lead to a bullish breakout

GBP/JPY Bearish Rejection – Short Trade Setup!🔹 Trendline Rejection ❌📈
Price tested the descending trendline and got rejected.
Bearish pressure increasing! 🚨
🔹 Resistance Zone (📍193.6 - 194.0) 🔵
Strong selling zone 📉
Stop Loss placed at 194.013 🚫
🔹 Support Zone (📍193.0) 🟦
Price might bounce here temporarily 🤔
If it breaks below, expect further drop 🚀📉
🔹 Target Level (📍192.311) 🎯
Bearish Target ✅
Ideal Take Profit 🏆
Trade Setup 💼
🔸 Entry: 📍193.5 - 193.6 📉
🔸 Stop Loss: ❌ 194.0 🚫
🔸 Take Profit: ✅ 192.3 🎯
Final Verdict: Sell Setup Active! 📉🔥
Watch for confirmation before entering! 👀🚀

GBPJPY Under Pressure: Potential Sell Opportunity.The GBPJPY pair has recently broken structure to the downside on the 4-hour timeframe, signaling bearish momentum. The pair is currently under significant selling pressure, with price action suggesting a potential continuation of the downtrend. Here's a deeper analysis of the situation:
Market Structure: The recent break of structure to the downside indicates that sellers are in control. The pair has failed to reclaim previous highs, reinforcing the bearish sentiment.
Key Levels:
Range High: The stop-loss level should be placed above the recent range high to manage risk effectively. This level acts as a key invalidation point for the bearish setup. 🚫
Range Low: The target is the previous range low, which aligns with a strong support zone. This level could act as a magnet for price, given the current bearish momentum. 🎯
Bearish Pressure: The pair is trading below key moving averages (e.g., 50 EMA and 200 EMA on the 4-hour chart), further confirming the bearish bias. Additionally, momentum indicators like RSI and MACD may show bearish divergence or oversold conditions, which could provide further confluence for the trade idea. 📊
Risk Management: As always, proper risk management is crucial. Ensure that the position size aligns with your trading plan, and avoid over-leveraging. 🔒
Fundamental Context: Keep an eye on any GBP or JPY-related news that could impact the pair, such as central bank decisions, economic data releases, or geopolitical developments. These factors could either accelerate or invalidate the current technical setup. 📰
Disclaimer ⚠️
This analysis is for educational and informational purposes only and does not constitute financial advice. Trading involves significant risk, and you should only trade with capital you can afford to lose. Always conduct your own research and consult with a financial professional before making any trading decisions. 📢

GBPJPY: Change in price behaviour, we may see possible upside! Dear Traders,
hope you are doing well, we have an excellent buying opportunity on gbpjpy where we can see price going up around 197 region where we can price see strong sell presence. Good luck and trade safe!

#GBPJPY: 681+ Pips Buying Chance from a Key Level. Dear Traders,
Since the Japanese Yen (JPY) experienced a significant decline in the market, prices have risen. This analysis examines two key areas: the complex bullish price behaviour and the rejection of prices at levels we are currently monitoring for potential entry. While this chart analysis serves as a secondary reference, it should complement your own trading strategies.
Best regards,
Team Setupsfx_

GBPJPYGBPJPY IS BULLISH. Buy this now and tp 195 and support 192 and consolidation zones.
GBPJPY BUY NOW

My Directional Bias on GBPJPY for the long run {29/03/2025}Educational Analysis says that GBPJPY may give countertrend opportunities from this range, according to my technical analysis.
Broker - FXCM
So, my analysis is based on a top-down approach from weekly to trend range to internal trend range.
So my analysis comprises of two structures: 1) Break of structure on weekly range and 2) External pushback to fill the remaining fair value gap
1) Break of structure on weekly range is down trend for the long run period of 10 years, may be it switch to new character or change its direction to bullish.
2) External pushback structure is the trading range where it trades on the smaller time frame,
On this structure range market on inside trading or smaller time frame is bullish towards fib of 1.618 and make turn to fill the fair value gaps of it.
Let's see what this pair brings to the table for us in the future.
Please check the comment section to see how this turned out.
DISCLAIMER:-
This is not an entry signal. THIS IS ONLY EDUCATIONAL PURPOSE ANALYSIS.
I have no concerns with your profit and loss from this analysis.
I HAVE NO CONCERNS WITH YOUR PROFIT OR LOSS,
Happy Trading, Fx Dollars.


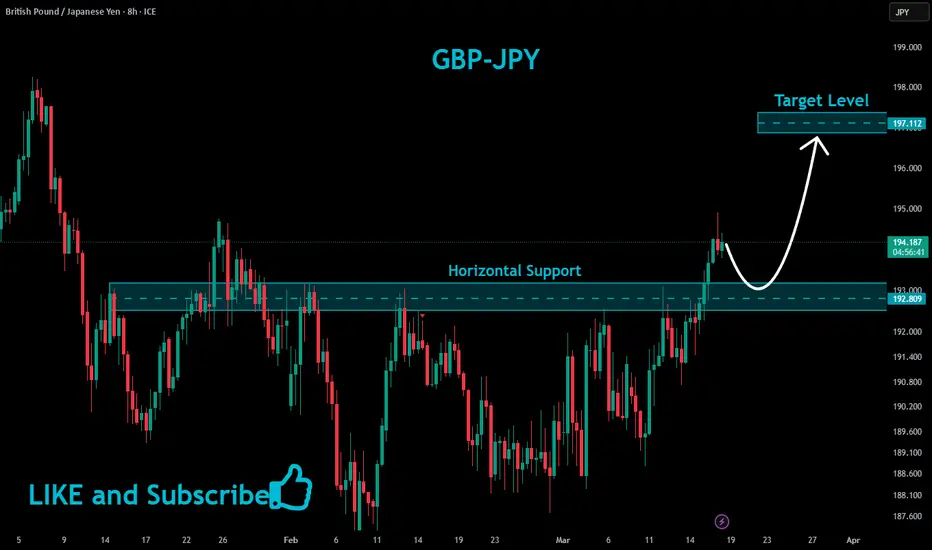
GBPJPY Bullish Bias!
HI,Traders !
GBPJPY is trading in an
Uptrend and the pair
Is making a local correction
But will soon hit a horizontal
Support of 192.809 from where
We will be expecting a local
Bullish rebound !
Comment and subscribe to help us grow !
GBPJPY - Short Term Sell Idea Update!!!Hi Traders, on March 26th I shared this idea "GBPJPY - Expecting Bearish Continuation In The Short Term"
We expected to see retraces and further continuation lower. You can read the full post using the link above.
Retrace and push lower happened until it was blocked by a bullish divergence.
If you enjoy this idea, don’t forget to LIKE 👍, FOLLOW ✅, SHARE 🙌, and COMMENT ✍! Drop your thoughts and charts below to keep the discussion going. Your support helps keep this content free and reach more people! 🚀
-------------------------------------------------------------------------------------------------------------------
Disclosure: I am part of Trade Nation's Influencer program and receive a monthly fee for using their TradingView charts in my analysis.

GBP/JPY: Fibonacci Levels Signal Possible Bullish ContinuationTechnical Analysis: GBP/JPY Bullish Continuation 📈
The GBP/JPY chart provided highlights a bullish trend continuation setup, supported by Fibonacci retracement levels. Here's a detailed breakdown:
📊 Fibonacci Levels in Play
The swing low to swing high has been plotted, revealing key retracement levels.
The price is currently near the 50% retracement level (194.326), a critical support zone in bullish trends.
The 61.8% retracement level (194.165), often called the "golden ratio," serves as a stronger support below this.
📈 Bullish Bias
The overall trend remains bullish, with higher highs and higher lows visible on the chart.
The corrective pullback to Fibonacci levels suggests a potential continuation of the upward momentum.
🎯 Target Projection
The arrow on the chart points to a projected move toward the 195.683 level, aligning with the -50% Fibonacci extension.
This target aligns with the bullish trend and indicates a potential breakout above the recent high.
🔍 Confluence and Confirmation
The price action shows signs of rejection at the 50% retracement level, indicating buyer interest.
A bullish candlestick pattern or increased volume near this zone would further confirm the upward move.
⚠️ Risk Management
The 61.8% level (194.165) is a key invalidation point. A break below this level could signal a deeper retracement toward the 78.6% level (193.937) or even the swing low.
This analysis is for informational purposes only and does not constitute financial advice. Trading involves significant risk, and you should only trade with capital you can afford to lose. Always conduct your own research and consult with a financial advisor before making trading decisions.


GBP/JPY – Breakout Incoming Hi Traders !, The price is forming an ascending triangle on the H1 chart. Watching for a breakout:
✅ Bullish if it breaks 194.92 with a pullback → Target 198.94.
❌ Bearish if it drops below 193.55 with confirmation → Target 187.35.
Waiting for volume validation , What do you think?
Disclaimer: This is not financial advice. Always do your own research and trade responsibly.
