GBPJPY Going UpGPYJPY fundamentals (COVID Vaccine optimism) and technicals analysis correspond to a good buy setup. Expect a retest to the indicated level, then a LONG to form new highs.
Gbpjpysetup

GBPJPY, 4hr tf, pennant / flag pattern to materializedHello my friends,
Today was such a good day, my trade managed to hit TP for 4.4R and i banked 8.8% profit.
I started to get my edge back and i am going to post more positions for everyone to trade.
My first setup for today is GBPJPY.
To me, the recent sideways movement looks like a pennant / flag pattern and today i finally see price retest those broken support.
We could expect price to continue decline on GBPJPY as the measured objective of this pattern is 275 pips.
Nearest support is arond 136.30 area so we will try to sell GBPJPY and see if price could touch this support.
Sell GBPJPY 137.80
Stop loss 138.30
Take profit 136.30 (3R)
RR Ratio 1 : 3
Use only 1-2% profit
Good luck

GJ Sells Breakdown 13/11/2020I don't usually take impulse entries but I
have taken a similar setup on GJ 3 times
before already this week and they were all
winning trades
Entry was taken at the point we broke below
the wick of the bearish 30m candle on support
anticipating price to come down to the next
support. I used my usual 2% risk and price
very quickly moved towards target
TP hit and I secured 3.2% account increase
If we flipped bullish I would have managed risk
by closing half of my positions so that if SL
hit I lost less than I was happy to lose.

GBPJPY - Big short sell opportunity finally readyI enter a short sell entry on this pair after it got rejected at the top of higher TF ascending channel structure continued by a brerak of small H1 bearish flag continuation pattern. Lets see how this one play out,..

GBPJPY SELL; A "devastating" SHORT!!Good for the next 2200 pips!
Also, the EURJPY
Also, the CADJPY
If one cares to know why the Yen is the ultimate Safe-Haven...
... here is a clue.

GBPJPY - FULL ANALYSIS BREAKDOWN Welcome traders to a free analysis breakdown.
Today I am highlighting possible trades on GBPJPY, if you any questions on the pair let me know in the comment section below.
Once the pair gives us a valid trade entry I will be sharing the trade with the Alpha community, I hope you all found this breakdown helpful .
If you liked this free educational please like and follow the channel, there is lots more valuable content right around the corner.
Feel free to comment a pair or subject you would like me to cover next.
Trade Safe
Alpha Trading Group.

GJLooking for buys on pound yen..analyse first before making decisions..happy trading and be blessed..

GBPJPY, 4hr tf, sell on 61.8 fibonacci retracementHello my friends,
Today is November 3rd and it means USA presidential election.
Please trade safely and play it carefully as we could see high volatility in the forex market during this time.
For today, i already closed all my positions and booked profit.
I am gonna review my closed positions first before starting with today trade idea
1st trade is EURCAD pairs which i closed at 1.5390 for +160 pips, banking +6.4% profit
2nd trade is NZDCHF pairs which i closed at 0.6110 for +55 pips, banking 4.4% profit
3rd trade is NZDJPY pairs which i closed at 69.90 for +90 pips, banking +4% profit
For today, i only gonna trade lightly with GBPJPY pairs.
Based on the daily timeframe you could see we are now at horizontal resistance level, which also happen to be 61.8% fibonacci retracement of recent downward movement.
This mean 136.45 is an area of confluences, sellers might come to try defending it
Sell GBPJPY 136.45
Stop loss 137.15
Take profit 133.35
RR ratio 1 : 4.4 (4.4R)
Use only 1-2% risk
Good luck

GBPJPY Long Trade SetupGBPJPY has just completed a 5-3 "impulse-corrective" wave cycle. According to the wave principle, once a 5-3 wave sequence is completed, we should expect the price to resume in the direction of the impulse pattern . In GBPJPY's case, the impulse is bullish in wave "a".
I will look for the break of the green lines to confirm my bullish thesis and have my stop loss at the red line . The price has the potential to reach the upper boundary of the parallel channel.
What's your view on GBPJPY? Let me know in the comment.
Thanks,
Veejahbee.
GBPJPY, 4hr tf, SHS pattern breakoutHello my friends,
I spotted a very good setup on GBPJPY pairs.
Price made a SHS pattern and it just break below the support with a solid candle close.
Notce also price smashed through the horizontal level so we could say this 136.40 level gonna be a strong resistance.
If we count the measured objective of this SHS pattern, it could go down towards 135.20 level
It is offering a 2R ratio so we wil try selling this pair.
Sell GBPJPY 136.40
Stop loss 137.00
Take profit 135.20
RR ratio 1 : 2
Use only 1-2% risk
Good luck

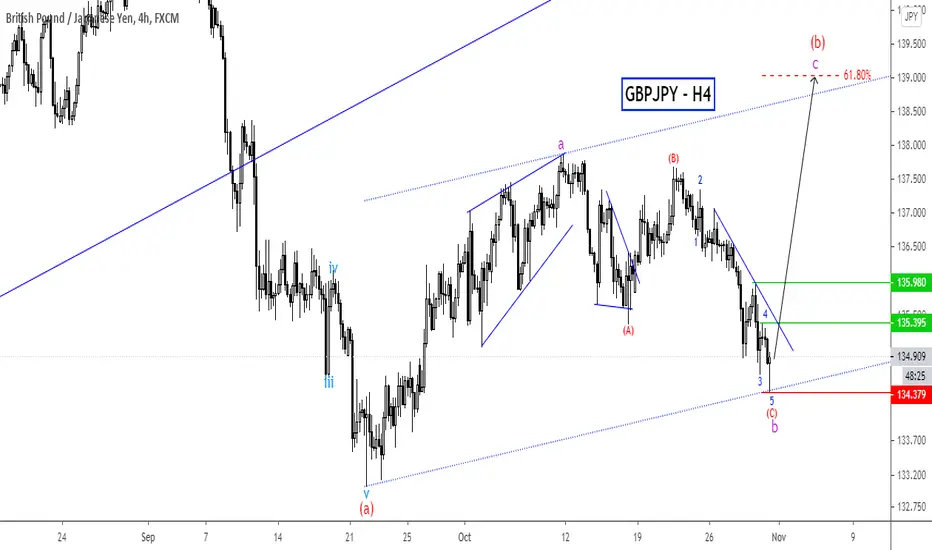
GBPJPY Set To Complete ABC Zigzag PatternGBPJPY has been in a sideways move for the past three weeks. This irregular move usually fits in for a triangle pattern in the Elliot Wave principle.
As you can see from the chart, the price made a sharp impulse move from wave (a) low, and since then the price is has been unfolding in a three-wave sequence in wave (A) through (E).
The decline in wave (E) of the triangle must not exceed wave (C) low for this count to remains valid. While the price is trading below the red line "wave (E)" low, I will look for a breakout of the green lines to confirm the completion of the triangle pattern and execute a long trade.
The anticipating rally in wave c of (b) of the zigzag pattern has the potential to equal the size of wave a.
What's your view on GBPJPY? Let me know in the comment.
Best of luck on the chart!
Veejahbee.
GBPJPY Watch for sellHi trades, Keep your eyes for GBPJPY to complete running flat then continuation to the downside.

GBPJPY, daily tf, sell the trend line retest with ichimokuHello my friends,
I got another setup coming for you today. Another pair with JPY which is GBPJPY.
I am using daily timeframe for this setup so don't expect price to move quickly along with our direction.
Noticed that price already break below the ascending trendline with a solid candle close from previous candle.
This upwards movement was only a retest of broken trend line in my opinion and we could see price go down again. There is also 61.8% fibonacci retracement resisance around 137.00 area so we could this could serve as a strong resistance.
I am going to take a sell position here because there is some confirmations from my screener.
1st confirmation is price below the kumo cloud
2nd confirmation is kumo cloud color is red
3rd confirmation is parbolic SAR now above the price indicating sell pressure
Sell GBPJPY 137.00
Stop loss 138.00
Take profit 1 at 135.85
Take profit 2 at 134.50
RR ratio is 1 : 2.5
Use only 1-2% risk
Good luck
Disclaimer : I sold GBPJPY from 137.00

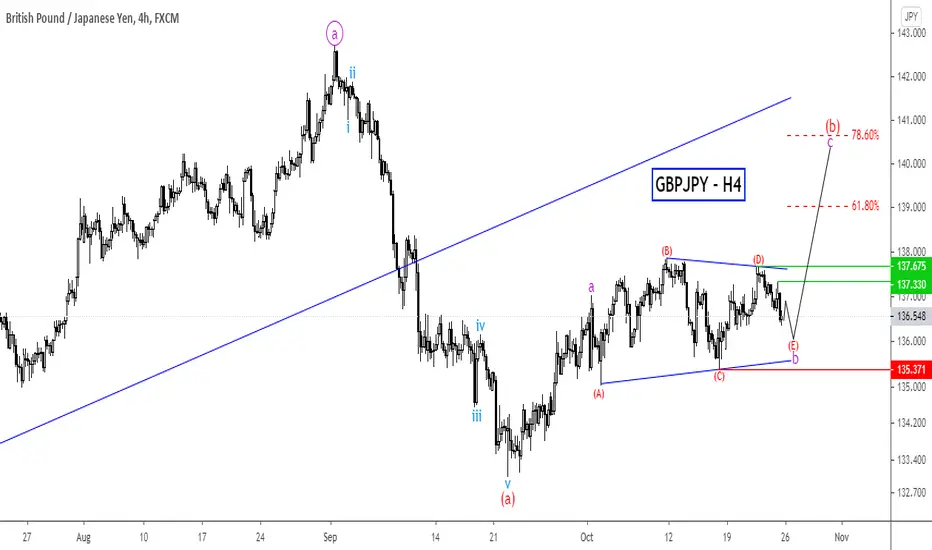
GBPJPY Bulls Are Overstaying Their WelcomeGBPJPY reversed from the resistance zone and broke out the S&R zone and daily ascending trendline impulsively.
According to the EW principle, a three-wave correction in opposite direction follows every impulse move.
That's what is currently unfolding as a bullish corrective move in wave (b) The correction seems to be unfolding as a zigzag and it's about to complete.
Once the correction is completed, the market resumes in the direction of the impulse. The bears have the potential to find a supply around broken S&R that lined up with 61.8 Fib.
Look for the break of the parallel channel for short entries.
Targets below wave (a) low is plausible in wave (c) of ((b)).
What's your opinion on GJ? Let's interact in the comment section.
Good luck on the chart!
Veejahbee.

GBPJPY Top-Down AnalysisHello Traders,
Here is the Top-Down Analysis of GBPJPY (Monthly, Weekly, Daily for direction and 4H for entry) for
Week 41 - 05 Oct
M > Market is respecting downward resistance trend line. Price faced rejection from resistance line and moved down. Price dropped and completed W formation.
W > We can see an M formation and expect price to rise up test the neck.
D > In its bearish move price respected all demand and supply zones created during its last upward move. After reversal price paused for consolidation at first supply zone, price is now making upward move towards second supply zone which also coincides with our target.
As per COT GBP saw closure of Long and addition of major short positions bringing net position to -ve, whereas N-R saw closure of both Long and Short, Commercials saw addition of Long and closure of Short. BXY was weak for the said week but it improved its position last week. JPY had closure of both Long and Short reducing net positions, this made JXY weak for the said week. Whereas JXY slightly recovered its position last week.
4H > Price has broken supply zone and its now making upward move towards our target.
Currency Correlation > Price has positive correlation with GBPUSD and negative correlation with EURGBP.
This was my Idea and I hope you find it useful. If you find the analysis of help please leave a LIKE and FOLLOW for receiving all updates during the week. In the comment section you can share your view and ask questions.
Thank You
AP17FX


GBPJPYGJ taking to the short position
Use Proper Risk Management
When in 20pips Profit, Breakeven with a 2 pip "Stop Profit"
Disclaimer: Past Results does not guarantee future results
Do your Due Diligence before taking the trade
Kindly drop comments, like and follow for more. Thanks

GJ Analysis 29/09/2020We are currently trading in a 16 pip range. If we break resistance and form support on lower timeframes there are potential scalp longs to fill the wick and maybe even push through with Asian volume. The target would be a wickfill as there is a clean range to move up. I would advise caution with sells because the range below support is very messy, if you were to take a sell, you would need resistance to form as your confirmations for sells. Buys are preferred

SHORT GBP/JPY | To complete the roof? Short...GBP/JPY
A roof? What do we have here?
on GBP/JPY all we see is a confirmation for a sell to 131.372
We might see a pull back to 135.576
Resistance levels: 135.576, 138.27
Support levels: 133.372, 131.168, 129.341
Let's watch...
#JustTradeFxOnline
Thanks for your love and support.
Don’t forget to like and comment for more.

GBPJPY - FULL ANALYSIS BREAKDOWN Welcome traders to a free analysis breakdown.
Today I am highlighting possible trade ares on GBPJPY, if you any questions on the pair let me know in the comment section below.
Once the pair gives us a valid trade entry I will be sharing the trade with the Alpha community, I hope you all found this breakdown helpful .
If you liked this free educational please like and follow the channel, there is lots more valuable content right around the corner.
Feel free to comment a pair or subject you would like me to cover next.
Trade Safe
Alpha Trading Group.

GBPJPY H1 Analysis Based On Price Action Theory.Sideways Trend
-Price Stuck between Resistance and Support.
Not move any direction

GJ Sell SetupMuch like GBPUSD there is a nice break and retest trade at this zone for a potential sell for another drop at the retest👍🏽
Make sure you use risk management and always look to trade with the trend💯

GBPJPY | MY PERSPECTIVE FOR THE WEEKOver 120pips fetched in my last publication (see link below for reference purposes) as another trading opportunity arises. The British Pound surrendered much of its Thursday gain on Friday to close the week below 141.000. despite this retraction, the possibility of a rally is still paramount as I have found two windows on the chart for buying opportunity.
Tendency: Uptrend ( Bullish )
Structure: Trendline | Support & Resistance | Channel
Observation: i. Price action has been contained between upward sloping parallel lines characterized by Higher highs and higher lows to make my Bullish bias emphatic.
ii. Major Support @ 139.300 - a structure which has been a strong hold for Bullish tendencies since 2016 could open us to a Buy opportunity if price breaks down 140.000level.
Trading plan: BUY confirmation with a minimum potential profit of 250 pips.
Risk/Reward: 1:4
Potential Duration: 3 to 8 days
NB: This speculation can be considered to make decisions on lower timeframes.
Watch this space for updates as price action is been monitored.
NirvanaForex
Risk Disclaimer:
Margin trading in the foreign exchange market (including foreign exchange trading, CFDs, etc.) has a high risk and is not suitable for all investors. The content of this speculation (including all data) is organized and published by me for the sole purpose of education and assistance in making independent investment decisions. All information herein is for your reference only and I take no responsibility.
You are hereby advised to carefully consider your investment experience, financial situation, investment objective, risk tolerance level, and consult your independent financial adviser as to the suitability of your situation prior to making any investment.
I do not guarantee its accuracy and is not liable for any loss or damage which may result directly or indirectly from such content or the receipt of any instruction or notification therewith.
Past performance is not necessarily indicative of future results.
