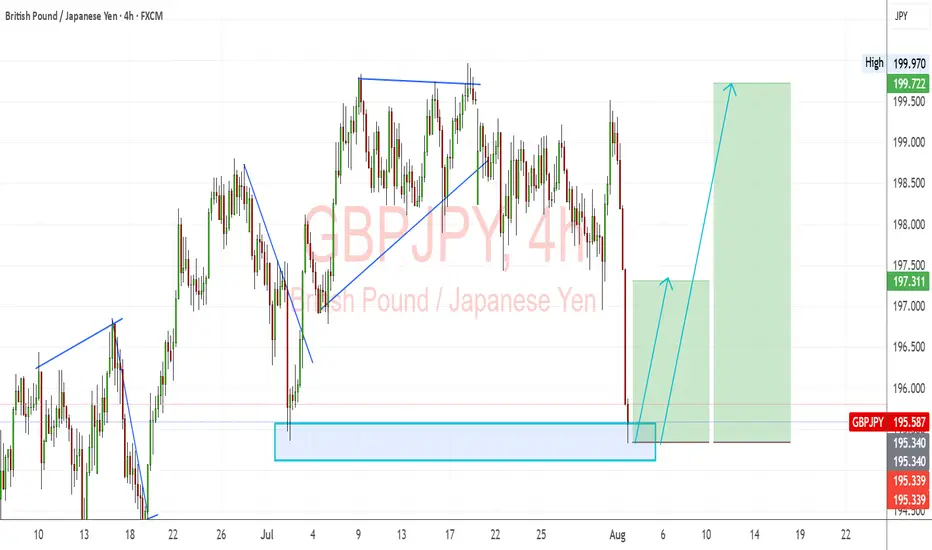
GBPJPY: Strong Bullish Reversal from Demand ZoneGBPJPY has bounced sharply from a key demand zone, indicating renewed bullish momentum. The pair continues to follow the broader bullish bias in GBP crosses, with JPY weakness driven by the Bank of Japan's dovish policy stance.
Technical Analysis (4H Chart)
Pattern: Bullish rejection from the 195.30–195.50 demand zone.
Current Level: 195.58, rebounding from strong support, setting up for a potential upward leg.
Key Support Levels:
195.34 – immediate demand zone and critical support.
194.90 – deeper backup support if a pullback occurs.
Resistance Levels:
197.31 – near-term resistance and first upside target.
199.72 – extended target if bullish continuation strengthens.
Projection: As long as 195.34 holds, GBP/JPY could push toward 197.31, with potential for 199.72 if GBP strength persists.
Fundamental Analysis
Bias: Bullish.
Key Fundamentals:
GBP: Supported by the BOE’s cautious but tight stance due to persistent inflation pressures.
JPY: Remains fundamentally weak, with the BoJ avoiding major policy tightening while intervention threats only provide short-term support.
Risk Sentiment: Mild risk-on conditions favor GBP over safe-haven JPY.
Risks:
BoJ FX intervention could temporarily strengthen JPY.
A dovish BOE shift could slow GBP momentum.
Key Events:
BOE policy updates and UK CPI.
BoJ commentary and risk sentiment indicators.
Leader/Lagger Dynamics
GBP/JPY is a leader among JPY pairs due to GBP’s volatility and strength. It often outpaces EUR/JPY and CHF/JPY, making it a key pair for JPY sentiment shifts.
Summary: Bias and Watchpoints
GBP/JPY is bullish, with price rebounding from the 195.34 demand zone. Upside targets are 197.31 and 199.72. Watch for BOE communication, BoJ intervention signals, and global risk sentiment for confirmation of the move.
Gbpjpyshort
GBPJPY Will Fall!
HI,Traders !
#GBPJPY has retested a
Horizontal resistance level
Of 198.903 so we are
Locally bearish biased
And from the resistance we
We will be expecting a
Local bearish correction !
Comment and subscribe to help us grow !

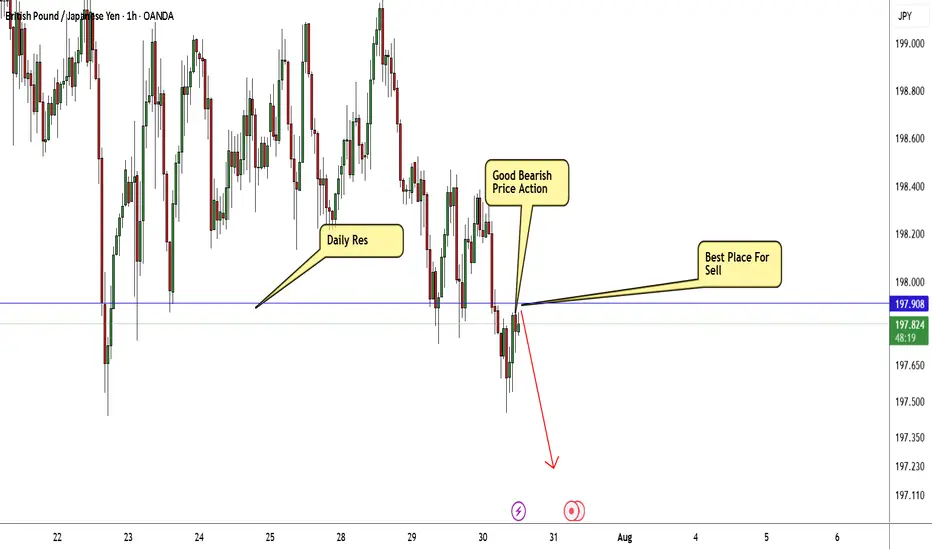
GBP/JPY Breakout Done , Short Setup Valid To Get 150 Pips !Here is my 1H Chart on GBP/JPY , We Have A Daily closure below my old support and new res and we have a very good bearish Price Action on 1And 2 Hours T.F , So i see it`s a good chance to sell this pair and targeting 100 to 150 pips . and if we have a daily closure again above my new res then this idea will not be valid anymore .
GBPJPY IdeaWe are waiting for our asset to reach our action zone, and based on the reaction, we’ll decide on our next moves.ALWAYS WAIT FOR A CONFIRMATION TO SEE IF THE PRICE VALIDATES THE ZONE.and you what is your vision of the EURUSD its interests me! i wait you in the commentary

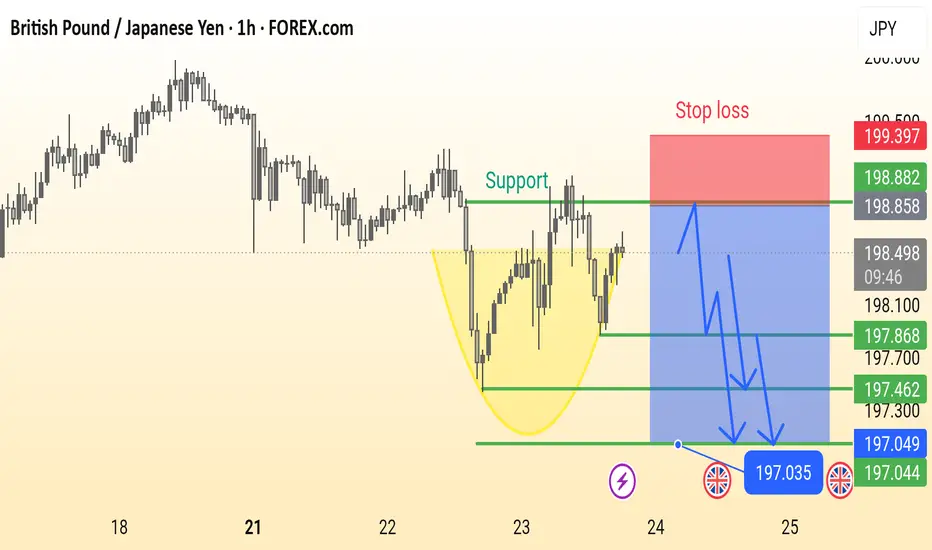
GBP/JPY Analysis is Ready This is a 1-hour chart of the GBP/JPY currency pair showing a potential bearish setup. Key elements include:
Support Zone: Around 198.000, previously tested multiple times.
Bearish Cup Pattern: Highlighted in yellow, suggesting a reversal.
Stop Loss: Marked above 199.397.
Sell Entry Zone: Near the support break at ~198.000.
Bearish Targets: 197.868 → 197.462 → 197.035 (with final support near 197.044).
Bearish Projection Arrows: Indicate expected price movement after breakdown.
This chart suggests a sell setup on breakdown, with well-defined risk and reward levels.
Gbpjpy buy signal. Don't forget about stop-loss.
Write in the comments all your questions and instruments analysis of which you want to see.
Friends, push the like button, write a comment, and share with your mates - that would be the best THANK YOU.
P.S. I personally will open entry if the price will show it according to my strategy.
Always make your analysis before a trade

British Pound / Japanese Yen - 4h (OANDA)4-hour candlestick chart from OANDA shows the GBP/JPY currency pair's price movement, currently at 199.038 with a decrease of 0.542 (-0.27%). The chart highlights a recent consolidation phase around the 199-200 range, with key levels marked at 201.000, 200.268, 199.038, 198.986, and 198.435. The data reflects trading activity as of 03:08:55.

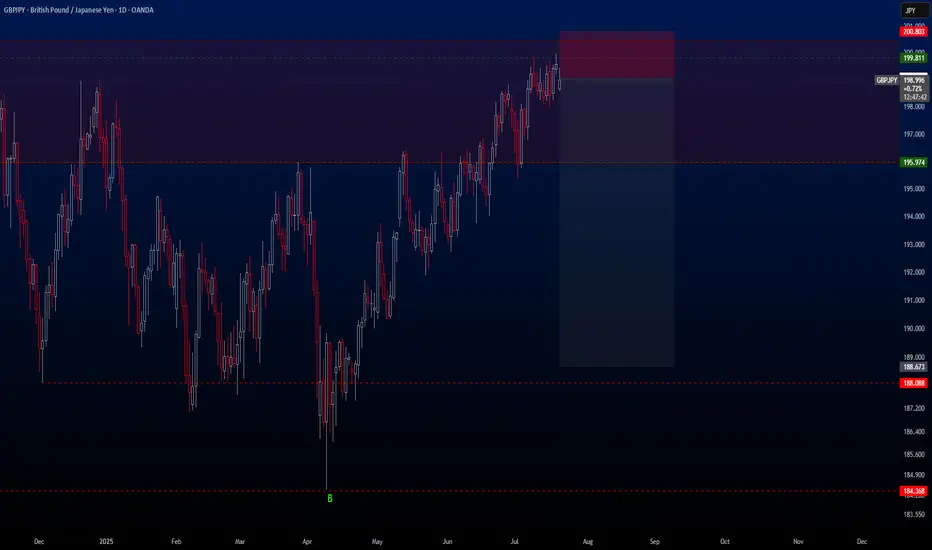
GBPJPYHello traders,
The holidays are over and we’re back to trading again! 🙂
Our first trade is on the **GBPJPY** pair. This setup is quite ideal for those thinking long-term. I’ve already activated this trade on my side.
🔍 **Trade Details**
✔️ **Timeframe**: D/W
✔️ **Risk-to-Reward Ratio**: 1:6
✔️ **Trade Direction**: Sell
✔️ **Entry Price**: 199.073
✔️ **Take Profit**: 188.673
✔️ **Stop Loss**: 200.803
🔔 **Disclaimer**: This is not financial advice. I’m simply sharing a trade I’ve taken based on my personal trading system, strictly for educational and illustrative purposes.
📌 Interested in a systematic, data-driven trading approach?
💡 Follow the page and turn on notifications to stay updated on future trade setups and advanced market insights.
GBPJPY in Premium Zones of 2008 Financial Crisis - {17/07/2025}Educational Analysis says that GBPJPY (FX pair) may give trend Trading opportunities from this range, according to my technical analysis.
Broker - FXCM
So, my analysis is based on a top-down approach from weekly to trend range to internal trend range.
So my analysis comprises of two structures: 1) Break of structure on weekly range and 2) Trading Range to fill the remaining fair value gap
Will Jpy start to lose value like it is doing since 2019 or it will do free fall same like 2008 crisis.
Let's see what this FX pair brings to the table for us in the future.
Please check the comment section to see how this turned out.
DISCLAIMER:-
This is not an entry signal. THIS IS FOR EDUCATIONAL PURPOSES ONLY.
I HAVE NO CONCERNS WITH YOUR PROFIT OR LOSS,
Happy Trading.

British Pound / Japanese Yen (GBP/JPY) 4-Hour Chart Analysis4-hour performance of the British Pound against the Japanese Yen (GBP/JPY) via OANDA data. The current price is 199.352, reflecting a 0.129 (0.06%) increase. The chart highlights a recent upward trend, with key support levels around 198.107 and 198.994, and resistance near 200.415. A breakout above the recent high is indicated, suggesting potential for further gains.

GBPJPY RangingGBPJPY is still in the range. For this range we can trade between the zones drawn. It has taken previous day high already. There is S&R level and supply zone if gets buyer push and crosses previous week high we may expect further bullish momentum. Till now we can trade between zones if we see any bullish signs.

GBPJPY Swing Trade Setup, Sell, Short SetupA Good RR setup, wait for the entry, when price reaches the poi, look for any weakness ltf and then take trade, we are taking trade on 1hr, so for entry look for 5m tf. I will update the trade status where to take or not!

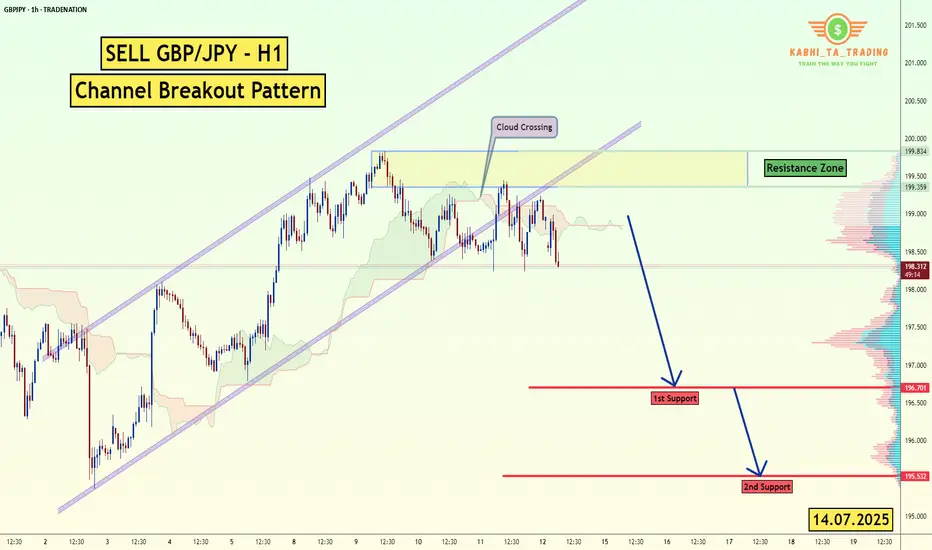
GBP/JPY -H1- Channel Breakout (14.07.2025)The GBP/JPY Pair on the H1 timeframe presents a Potential Selling Opportunity due to a recent Formation of a Channel Breakout Pattern. This suggests a shift in momentum towards the downside in the coming hours.
Possible Short Trade:
Entry: Consider Entering A Short Position around Trendline Of The Pattern.
Target Levels:
1st Support – 196.70
2nd Support – 195.53
🎁 Please hit the like button and
🎁 Leave a comment to support for My Post !
Your likes and comments are incredibly motivating and will encourage me to share more analysis with you.
Best Regards, KABHI_TA_TRADING
Thank you.
Disclosure: I am part of Trade Nation's Influencer program and receive a monthly fee for using their TradingView charts in my analysis.
GBPJPY Sweet ProfitsThe Key Levels that I shared previously for GBPJPY are drawn carefully by observing the market behavior previously. I suggest look at that key levels and plan your trades accordingly. I took the trade on the key levels I drawn. It gave me 1:2.85 . These key levels represent the behavior of the market.

GBPJPY is in the Down Trend From Resistance LevelHello Traders
In This Chart GBPJPY HOURLY Forex Forecast By FOREX PLANET
today GBPJPY analysis 👆
🟢This Chart includes_ (GBPJPY market update)
🟢What is The Next Opportunity on GBPJPY Market
🟢how to Enter to the Valid Entry With Assurance Profit
This CHART is For Trader's that Want to Improve Their Technical Analysis Skills and Their Trading By Understanding How To Analyze The Market Using Multiple Timeframes and Understanding The Bigger Picture on the Charts

GBPJPY is Holding above the SupportHello Traders
In This Chart GBPJPY HOURLY Forex Forecast By FOREX PLANET
today GBPJPY analysis 👆
🟢This Chart includes_ (GBPJPY market update)
🟢What is The Next Opportunity on GBPJPY Market
🟢how to Enter to the Valid Entry With Assurance Profit
This CHART is For Trader's that Want to Improve Their Technical Analysis Skills and Their Trading By Understanding How To Analyze The Market Using Multiple Timeframes and Understanding The Bigger Picture on the Charts

GBP/JPY At Selling Area , Can We Sell It Now To Get 150 Pips ?Here is my opinion on GBP/JPY , The price at daily res area that forced the price to go down very hard last time and now the price retesting it , i want to see a good bearish price action on 4H T.F To get A Confirmation to can sell and i feel safe , we can enter now a sell trade with small lot size and when we have a good confirmation on bigger T.F We can add another entry , if we have a daily closure above my daily res then this idea will not be valid .

British Pound / Japanese Yen - 4H Chart (OANDA)4-hour chart from OANDA displays the GBP/JPY currency pair's price movement, with the current price at 199.248 (+0.024 or +0.01%). The chart highlights a recent upward trend, breaking through a resistance level around 199.274, with buy and sell indicators at 199.274 and 199.220 respectively. Key price levels include a high of 199.923 and a low of 198.188, with the chart spanning from June to early August 2025.

GBPJPY Shown Good Pullback after hitting Swing HighAs share earlier GJ show good bullish move and hit swing high. After hitting swing has given a good pull back and entered into the trade. The engulfing hourly candle showing strong pullback which will possibly go further down to retest a demand zone and an area.

SHORT ON GBP/JPYGJ currently has broken a strong low of a rising wedge pattern (which is a bearish reversal pattern.
I am waiting for price to hit the supply zone before entering for a sell.
So a sell limit order will need to placed at the supply zone to take advantage of this opportunity.

GBPJPY SHORT DAILY FORECAST Q3 D7 W28 Y25GBPJPY SHORT DAILY FORECAST Q3 D7 W28 Y25
Professional Risk Managers👋
Welcome back to another FRGNT chart update📈
Diving into some Forex setups using predominantly higher time frame order blocks alongside confirmation breaks of structure.
Let’s see what price action is telling us today! 👀
💡Here are some trade confluences📝
✅Daily Order block identified
✅4H Order Block identified
✅1H Order Block identified
🔑 Remember, to participate in trading comes always with a degree of risk, therefore as professional risk managers it remains vital that we stick to our risk management plan as well as our trading strategies.
📈The rest, we leave to the balance of probabilities.
💡Fail to plan. Plan to fail.
🏆It has always been that simple.
❤️Good luck with your trading journey, I shall see you at the very top.
🎯Trade consistent, FRGNT X
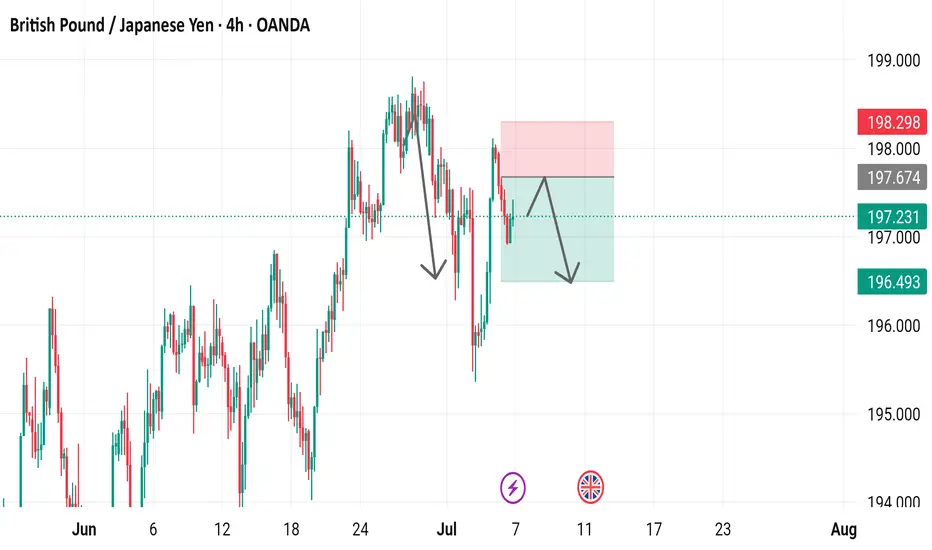
GBP/JPY 4-Hour Chart Analysis - OANDA4-hour chart of the British Pound (GBP) against the Japanese Yen (JPY) from OANDA shows a recent price of 197.231, with a decrease of 0.653 (-0.33%). The chart highlights a sell signal at 197.006 and a buy signal at 197.456, with a 45.0 pip difference. A downward trend is indicated with a shaded resistance zone between 198.298 and 197.674, suggesting potential selling pressure as the price approaches this level. The chart covers data from late June to early July 2025.
Shorty GbpJpyLook for liquidity sweep at the end of each trend
Mark your retracement zones
Use Fibonacci to find your sl and tp zones
Rule of your deposit
Try to set sl at 10% of your deposit
Use a reasonable lot size
AND MAKE A TRADE
