GBPJPY: More Growth is Coming! 🇬🇧🇯🇵
GBPJPY will likely bounce from a key daily support,
following a formation of a double bottom pattern
on an hourly time frame.
I think that the price will reach 196.7 level soon.
❤️Please, support my work with like, thank you!❤️
I am part of Trade Nation's Influencer program and receive a monthly fee for using their TradingView charts in my analysis.
Gbpjpysignals

"GBP/JPY: High-Risk Pips Grab – Escape Before Cops! 🏴☠️ GBP/JPY "Dragon Heist" – Bulletproof Bullish Raid (High-Risk, High-Reward) 🚨
🔥 Attention Market Pirates & Profit Raiders! 🔥
(Day/Swing Trade Plan – Long Entry Focused)
🔑 Entry Zone (Vault Cracked!):
"The Dragon’s loot is unguarded! Bullish pullback = prime stealing opportunity."
Buy Limit Orders: Layer entries near 15M/30M swing lows (wick/body). DCA-friendly!
Thief Pro Tip: Scalpers ride long-only waves. Swing traders? Stack slowly, escape rich.
🎯 Target (Escape Routes):
200.600 (or bail early if cops (resistance) swarm!)
🚨 Red Zone = High-Risk Take-Profit (Overbought? Reversal? Police (bears) lurk here!)
⛔ Stop Loss (Emergency Exit):
4H Swing Low/High (Wick-based) – Adjust for risk/lot size!
No martyr trades! SL = your heist survival kit.
📢 Breaking News (Fundamental Edge):
Dragon’s bullish fuel? Macro data, COT reports, sentiment—CHEK THE LIiNKk 👉🔗 (Don’t skip homework!)
💣 Trading Alerts:
News = Landmines! Avoid new trades during releases.
Trailing SL = Your Getaway Car (Lock profits, dodge volatility.)
💥 Boost This Heist!
Smash 👍, hit 🔔, and fund our next raid! Every boost = more stolen pips for the crew.
Stay tuned—another heist drops soon! 🤑 #ForexBandits

GBPJPY Potentially BullishOANDA:GBPJPY has been on a bullish trajectory and with the current breakout to the upside signifying a potential bullish continuation. With this in mind, I will wait to see a proper re-test around the 196.839 and then see a price action confirmation before taking the trade. Until then, fingers crossed.
#GBPJPY
Disclaimer: Past results does not guarantee future results, do your due diligence.
#GBPJPY: 600+ Pips Swing Move, JPY To Drop! GBPJPY has successfully rejected the area previously identified in our analysis of GJ. We had anticipated a price rejection and reversal with a strong bullish impulse, which has materialised. Following the positive candle close on Friday, we anticipate a continuation of the bullish trend and potential reaching of the 200 mark.
When trading, it is crucial to prioritise risk management. Conduct your own analysis and utilise this information solely for educational purposes.
Three potential targets have been identified: 198, 200, and 202. A stop loss can be positioned below our buying zone, as indicated by the black-marked zone.
Your support, expressed through likes, comments, and shares, is greatly appreciated and encourages us to continue providing valuable content.
❤️🚀
Team Setupsfx_

GBPJPY: Pullback From Trend Line 🇬🇧🇯🇵
I think that GBPJPY may bounce from a rising trend line
that I spotted on a daily time frame.
As a confirmation, I spotted 2 intraday bullish breakouts:
a violation of a resistance line of a falling channel
and a breakout of a neckline of a cup & handle pattern.
Goal - 195.0
❤️Please, support my work with like, thank you!❤️
I am part of Trade Nation's Influencer program and receive a monthly fee for using their TradingView charts in my analysis.

GBPJPY Strong rebound. Buy opportunity.The GBPJPY pair has been trading within an Ascending Triangle pattern. Today's geopolitics made the price form its latest Higher Low at the bottom of the pattern, which also coincided with a 4H MA200 (orange trend-line) test, and rebounded.
That was a clear buy signal on the 4H RSI Support that signaled the last three bottom buys. Our Target is the top of the pattern at 196.300.
-------------------------------------------------------------------------------
** Please LIKE 👍, FOLLOW ✅, SHARE 🙌 and COMMENT ✍ if you enjoy this idea! Also share your ideas and charts in the comments section below! This is best way to keep it relevant, support us, keep the content here free and allow the idea to reach as many people as possible. **
-------------------------------------------------------------------------------
Disclosure: I am part of Trade Nation's Influencer program and receive a monthly fee for using their TradingView charts in my analysis.
💸💸💸💸💸💸
👇 👇 👇 👇 👇 👇

GBPJPY Channel Down making a Lower High rejectionThe GBPJPY pair rose aggressively since the last time we gave our buy signal (April 11, see chart below), quickly hitting our conservative 109.250 Target:
The price has since made a Lower High rejection at the top of the Channel Down but remains supported by the 1D MA50 (blue trend-line). Once broken and it closes a 1D candle below it, we will have bearish break-out signal. Our Targe will be 185.250, which will be the standard -5.85% decline that all 3 previous Bearish Legs had within the Channel Down.
-------------------------------------------------------------------------------
** Please LIKE 👍, FOLLOW ✅, SHARE 🙌 and COMMENT ✍ if you enjoy this idea! Also share your ideas and charts in the comments section below! This is best way to keep it relevant, support us, keep the content here free and allow the idea to reach as many people as possible. **
-------------------------------------------------------------------------------
💸💸💸💸💸💸
👇 👇 👇 👇 👇 👇

GBPJPY UPDATE: BUY SignalBuy trade is floating +60 pips in profit running risk free. Final target is the unmitigated OB around 193.2.
ENTRY 191.193
SL 190.5
TP1 191.393
TP2 191.693
TP3 192.193
TP4 193.193

GBPJPY: Are Bulls Ready To Rally?I've already entered a buy. A more conservative entry would be to wait for the descending TL break and retest. Another potential buy entry would be a buy stop around 191.743.
Confirmations:
- Bullish CHoCH
- Creating new HHs and HLs
- Multiple Bullsih FVGs
- Trading above major QP 190
Group Signal:
Entry 191.066
SL 190.5
TP1 191.266
TP2 191.566
TP3 192.066
TP4 193.066

GBPJPY Reclaims 190 – Ready for 195?After breaking below the 188.00 support zone and testing 184.50 support, GBPJPY quickly reversed, signaling strong buying interest and a classic false breakdown.
Last week, the pair also reclaimed the key 190.00 level – an important technical and psychological area – showing clear strength and readiness for a potential continuation higher.
The key question now: Is GBPJPY ready to launch towards new highs?
Here’s why I stay bullish:
- Strong rejection at 184.50 confirms buyer dominance.
- Recovery above 190.00 is a major bullish signal.
- Market structure now favors buying dips
T rading Plan:
I’m looking to buy dips, staying bullish as long as 187.00 remains intact.
🎯 Targeting a move towards 195.00.
Disclosure: I am part of Trade Nation's Influencer program and receive a monthly fee for using their TradingView charts in my analyses and educational articles.

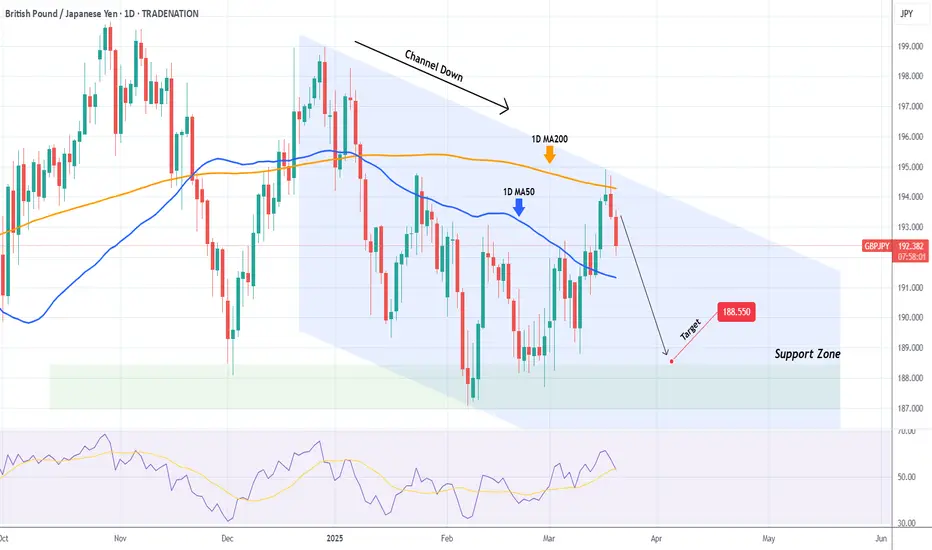
GBPJPY Channel Down bottom reached. Rebound expected.Last time we looked into the GBPJPY pair (March 20, see chart below) we had a sell signal which dully delivered our 188.550 Target:
This time we have the price at the bottom (Lower Lows trend-line) of the extended Channel Down, with the 1D RSI almost reaching the 30.00 oversold limit. All such bottoms were followed by a rebound that hit at least the 1D MA50 (blue trend-line) before a new Channel Down Lower Low.
As a result, we are going for a short-term buy here, targeting a potential contact with the 1D MA50 at 190.250.
-------------------------------------------------------------------------------
** Please LIKE 👍, FOLLOW ✅, SHARE 🙌 and COMMENT ✍ if you enjoy this idea! Also share your ideas and charts in the comments section below! This is best way to keep it relevant, support us, keep the content here free and allow the idea to reach as many people as possible. **
-------------------------------------------------------------------------------
Disclosure: I am part of Trade Nation's Influencer program and receive a monthly fee for using their TradingView charts in my analysis.
💸💸💸💸💸💸
👇 👇 👇 👇 👇 👇

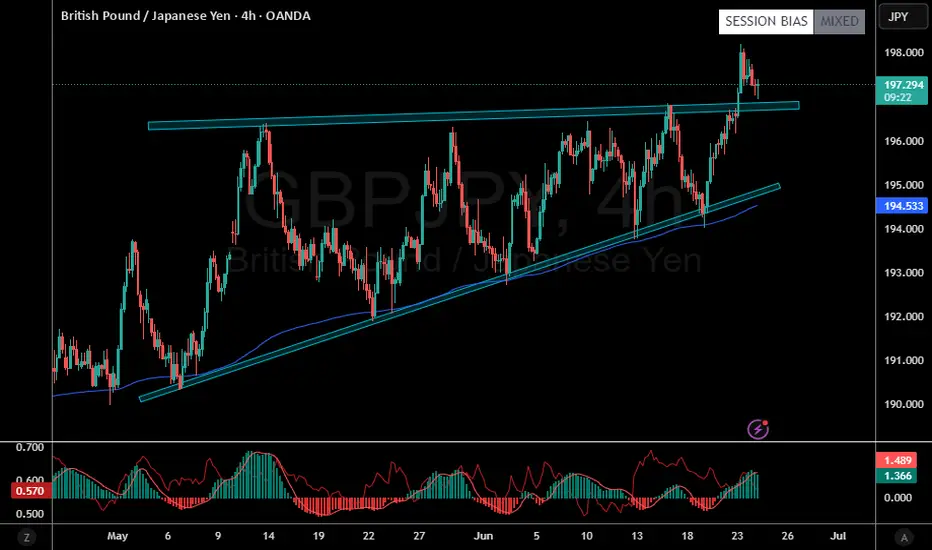
GBPJPY: Breakout & Bullish Continuation 🇬🇧🇯🇵
I see a confirmed breakout of a significant daily resistance on GBPJPY.
The price will most likely continue rising within a wedge pattern.
The next goal for the buyers is 197.0.
❤️Please, support my work with like, thank you!❤️
I am part of Trade Nation's Influencer program and receive a monthly fee for using their TradingView charts in my analysis.

GBPJPY: Time to Grow?! 🇬🇧🇯🇵
GBPJPY looks strongly bullish after the release of the today's fundamentals.
Bullish accumulation on an hourly time frame looks completed
and the price has just formed a high momentum bullish candle.
I expect a bullish movement at least to 194.6 level now.
❤️Please, support my work with like, thank you!❤️

GBPJPY: Are Bulls Ready To Rally?GJ is still in an uptrend so I am buying. My entry was 193.825
Bullish Confirmations
- M15 and M30 Bullish CHoCH
- M15 Bullish breaker blocks
- Formed new HH and HL
- Bullish FVGs
🟢BUY GJ
SL 43 pips
TP1 20 pips
TP2 50 pips
TP3 100 pips

GBPJPY 1D MA200 rejection. Channel Down sell signal.The GBPJPY pair has been trading within a Channel Down pattern and the recent Bullish Leg got rejected yesterday on the 1D MA200 (orange trend-line). If the 1D RSI closes below its MA trend-line, we will have the ideal sell confirmation signal.
Our Target is the top of the 4-month Support Zone at 188.550.
-------------------------------------------------------------------------------
** Please LIKE 👍, FOLLOW ✅, SHARE 🙌 and COMMENT ✍ if you enjoy this idea! Also share your ideas and charts in the comments section below! This is best way to keep it relevant, support us, keep the content here free and allow the idea to reach as many people as possible. **
-------------------------------------------------------------------------------
Disclosure: I am part of Trade Nation's Influencer program and receive a monthly fee for using their TradingView charts in my analysis.
💸💸💸💸💸💸
👇 👇 👇 👇 👇 👇
GBPJPY Bulls Are Back In TownAs explained in the video, we have several bullish confirmations...
Key Sup 190.3
Key Res 193
- Bullish CHoCH
- Formed a new HH and HL
- H4 TL break and retest
- Retest of bullish OB
- Multiple bullish FVGs
- Bullish MACD
I have a small position open...
🟢BUY GJ 192.315
SL 191.6
TP1 192.515
TP2 192.815
TP3 193.315
TP4 194.315
Will scale in another position if we get a break and close above 193.

GBPJPY: Time For Pullback 🇬🇧🇯🇵
On the today's live stream, we discussed a selling opportunity on GBPJPY.
The market looks bearish after a test of a key horizontal resistance.
A formation of a bearish engulfing candle confirms the strength of the sellers.
I expect a retracement to 190.15
❤️Please, support my work with like, thank you!❤️
I am part of Trade Nation's Influencer program and receive a monthly fee for using their TradingView charts in my analysis.

GBPJPY Finally Breaks Out Of Range: Should We Buy?I am buying GJ...
- BOS
- Bullish CHoCH
- Creating new HHs and HLs
- Retest of Bullish OB
- Sell side liquidity grab
Entry 189.347
SL 188.6
TP1 189.547
TP2 189.847
TP3 190.347
TP4 191.347
I have a price alert set for 190. Let's see how it goes...

GBP/JPY "The Beast" Forex Market Heist Plan🌟Hi! Hola! Ola! Bonjour! Hallo! Marhaba!🌟
Dear Money Makers & Thieves, 🤑 💰🐱👤🐱🏍
Based on 🔥Thief Trading style technical and fundamental analysis🔥, here is our master plan to heist the ˗ˏˋ ★ ˎˊ˗GBP/JPY "The Beast" ˗ˏˋ ★ ˎˊ˗ Forex Market. Please adhere to the strategy I've outlined in the chart, which emphasizes short entry. Our aim is the high-risk Green Zone. Risky level, oversold market, consolidation, trend reversal, trap at the level where traders and bullish thieves are getting stronger. 🏆💸Book Profits Be wealthy and safe trade.💪🏆🎉
Entry 📈 : "The heist is on! Wait for the breakout (187.700) then make your move - Bearish profits await!" however I advise placing Sell limit orders within a 15 or 30 minute timeframe. Entry from the most recent or closest low or high level should be in retest.
Stop Loss 🛑: Thief SL placed at (190.500) swing Trade Basis Using the 3H period, the recent / swing high or low level.
SL is based on your risk of the trade, lot size and how many multiple orders you have to take.
Target 🎯: 185.000 (or) Escape Before the Target
🧲Scalpers, take note 👀 : only scalp on the Short side. If you have a lot of money, you can go straight away; if not, you can join swing traders and carry out the robbery plan. Use trailing SL to safeguard your money 💰.
📰🗞️Fundamental, Macro, COT Report, Sentimental Outlook:
GBP/JPY "The Beast" Forex Market is currently experiencing a Bearish trend in short term, driven by several key factors.
˗ˏˋ ★ ˎˊ˗Fundamental Analysis˗ˏˋ ★ ˎˊ˗
Interest Rates: BoE at 4-4.5% (easing cycle), BoJ at 0.25-0.5%—yield gap narrows, mildly bearish for GBP/JPY.
Inflation: UK at 2.5-3% (cooling), Japan at 2.5% (persistent)—neutral, balances GBP vs. JPY strength.
Growth: UK GDP ~1-1.5%, Japan ~1%—both modest, neutral impact.
Trade: UK exports lag, Japan benefits from U.S. tariff shifts—bullish for JPY, bearish for GBP/JPY.
Risk Sentiment: Safe-haven JPY gains in risk-off—bearish pressure.
˗ˏˋ ★ ˎˊ˗Macroeconomic Factors˗ˏˋ ★ ˎˊ˗
U.S.: Fed at 3-3.5%, PCE 2.6%—USD softness aids GBP/JPY—bullish (Eurostat/U.S. data).
Eurozone: PMI 46.2—stagnation weakens EUR, indirectly supports GBP—bullish (Eurostat).
Global: China 4.5%, Japan 1%—slow growth, JPY safe-haven appeal—bearish (ECB forecasts).
Commodities: Oil $70.44—stable, neutral for GBP/JPY (global data).
Trump Policies: Tariffs shift trade to Japan—JPY strength, bearish for GBP/JPY.
˗ˏˋ ★ ˎˊ˗Global Market Analysis˗ˏˋ ★ ˎˊ˗
Forex Markets: GBP/USD at 1.2650, USD/JPY at 150.00—GBP resilience vs. JPY strength—mixed.
Equity Markets: FTSE 100 stable, Nikkei range-bound—neutral correlation.
Crypto/Commodities: Gold at $2,930—risk-off supports JPY—bearish.
˗ˏˋ ★ ˎˊ˗Commitments of Traders (COT) Data˗ˏˋ ★ ˎˊ˗
Speculators: Net short JPY ~140,000 contracts (down from 150,000)—fading bearishness, mildly bullish JPY.
Hedgers: Net long JPY ~90,000—exporters expect JPY strength, bearish for GBP/JPY.
Open Interest: ~280,000 contracts—steady interest, neutral.
˗ˏˋ ★ ˎˊ˗Market Sentiment Analysis˗ˏˋ ★ ˎˊ˗
Retail: 65% short GBP/JPY at 189.50 (global X posts)—contrarian upside—bullish potential.
Institutional: Cautious, favoring JPY in risk-off—bearish outlook.
Corporate: UK/Japan firms hedge at 190-192—neutral.
Social Media Trends: Bearish setups to 185.00—short-term bearish sentiment.
˗ˏˋ ★ ˎˊ˗Positioning Analysis˗ˏˋ ★ ˎˊ˗
Speculative: Longs target 192.00-194.00, shorts aim for 188.00-185.00.
Retail: Shorts at 190.00-191.00—squeeze risk if price rises.
Institutional: Leaning short GBP/JPY, eyeing JPY strength.
˗ˏˋ ★ ˎˊ˗Quantitative Analysis˗ˏˋ ★ ˎˊ˗
SMAs: 50-day ~194.00, 200-day ~193.00—price below both, bearish signal.
RSI: 45 (daily)—neutral, fading bearish momentum.
Bollinger: 188.50-190.50—price near lower band, potential bounce.
Fibonacci: 38.2% from 198.94-189.31 at 190.50—resistance above.
Volatility: 1-month IV 10%—±1.80 daily range.
˗ˏˋ ★ ˎˊ˗Intermarket Analysis˗ˏˋ ★ ˎˊ˗
GBP/USD: 1.2650—GBP holds vs. USD, bullish for GBP/JPY.
USD/JPY: 150.00—JPY weakens vs. USD, bullish for GBP/JPY.
XAU/USD: $2,930—gold rise, JPY safe-haven—bearish.
FTSE 100: Stable—neutral.
Bonds: UK 10-year 4%, Japan 0.9%—yield gap narrows, bearish.
˗ˏˋ ★ ˎˊ˗News and Events Analysis˗ˏˋ ★ ˎˊ˗
Recent: Trump tariff threats (25% Mexico/Canada, 10% China, Feb 25)—risk-off lifts JPY—bearish.
Upcoming: U.S. PCE today (Feb 28)—hot data strengthens USD, pressures GBP/JPY; soft data boosts risk-on, supports GBP—mixed impact.
Impact: Bearish bias today, PCE reaction pivotal.
˗ˏˋ ★ ˎˊ˗Next Trend Move˗ˏˋ ★ ˎˊ˗
Technical:
Support: 188.50-188.00
Resistance: 190.50-192.00
Below 188.50 targets 185.00; above 190.50 aims for 194.00.
Short-Term (1-2 Days): Dip to 188.00 if PCE lifts USD; rebound to 190.50 if risk-on prevails.
Medium-Term (1-3 Months): Range 185.00-195.00, tariff/JPY strength key.
˗ˏˋ ★ ˎˊ˗Overall Summary Outlook˗ˏˋ ★ ˎˊ˗
GBP/JPY at 189.50 faces bearish short-term pressure from JPY safe-haven demand (tariffs, risk-off) and technicals (below SMAs), despite GBP resilience vs. USD. COT shows fading JPY shorts, sentiment leans bearish, and PCE today could sway direction. A short-term dip to 188.00 is likely, with medium-term consolidation unless macro shifts favor GBP.
˗ˏˋ ★ ˎˊ˗Future Prediction˗ˏˋ ★ ˎˊ˗
Bullish: 192.00-195.00 by Q2 2025 if USD softens (DXY to 105), risk-on resumes, or BoE holds rates.
Bearish: 185.00-188.00 if JPY strengthens (USD/JPY to 145), tariffs escalate, or risk-off persists.
Prediction: Bearish short-term to 188.00 (PCE/USD strength), then cautiously bullish to 192.00 by mid-2025 (risk-on recovery).
📌Keep in mind that these factors can change rapidly, and it's essential to stay up-to-date with market developments and adjust your analysis accordingly.
⚠️Trading Alert : News Releases and Position Management 📰 🗞️ 🚫🚏
As a reminder, news releases can have a significant impact on market prices and volatility. To minimize potential losses and protect your running positions,
we recommend the following:
Avoid taking new trades during news releases
Use trailing stop-loss orders to protect your running positions and lock in profits
💖Supporting our robbery plan 💥Hit the Boost Button💥 will enable us to effortlessly make and steal money 💰💵. Boost the strength of our robbery team. Every day in this market make money with ease by using the Thief Trading Style.🏆💪🤝❤️🎉🚀
I'll see you soon with another heist plan, so stay tuned 🤑🐱👤🤗🤩

GBP/JPY "The Beast" Forex Market Heist Plan🌟Hi! Hola! Ola! Bonjour! Hallo! Marhaba!🌟
Dear Money Makers & Robbers, 🤑💰🐱👤🐱🏍
Based on 🔥Thief Trading style technical and fundamental analysis🔥, here is our master plan to heist the GBP/JPY "The Beast" Forex market. Please adhere to the strategy I've outlined in the chart, which emphasizes long entry. Our aim is the high-risk Red Zone. Risky level, overbought market, consolidation, trend reversal, trap at the level where traders and bearish robbers are stronger. 🏆💸Book Profits Be wealthy and safe trade.💪🏆🎉
Entry 📈 : "The vault is wide open! Swipe the Bullish loot at any price - the heist is on!
however I advise placing Buy limit orders within a 15 or 30 minute timeframe. Entry from the most recent or closest low or high level should be in retest.
Stop Loss 🛑: Thief SL placed at (188.000) swing Trade Basis Using the 2H period, the recent / nearest low level.
SL is based on your risk of the trade, lot size and how many multiple orders you have to take.
Target 🎯: 197.000 (or) Escape Before the Target
🧲Scalpers, take note 👀 : only scalp on the Long side. If you have a lot of money, you can go straight away; if not, you can join swing traders and carry out the robbery plan. Use trailing SL to safeguard your money 💰.
📰🗞️Fundamental, Macro, COT, Sentimental Outlook:
GBP/JPY "The Beast" Forex Market market is currently experiencing a bullish trend,., driven by several key factors.
💥Fundamental Analysis
UK Economic Growth: The UK's economic growth has slowed down to 1.2% in the last quarter, due to the ongoing Brexit uncertainty.
Japan Economic Growth: Japan's economic growth has remained steady at 0.5% in the last quarter, driven by the government's stimulus packages.
Interest Rate Differential: The interest rate differential between the UK and Japan has widened, with the UK's interest rate at 4.25% and Japan's interest rate at -0.1%.
💥Macro Economics
Inflation Rate: The UK's inflation rate has decreased to 2.5% in the last month, while Japan's inflation rate has remained steady at 0.5%.
Unemployment Rate: The UK's unemployment rate has remained steady at 3.5%, while Japan's unemployment rate has decreased to 2.2%.
Global Trade: The ongoing trade tensions between the US and China are expected to have a minimal impact on the GBP/JPY market.
💥Global Market Analysis
Forex Market: The global forex market has experienced a moderate increase in volatility, with the GBP/JPY pair experiencing a 1.5% increase in the last 24 hours.
Commodity Market: The global commodity market has experienced a moderate decrease, with oil prices decreasing by 1.2% in the last 24 hours.
Stock Market: The global stock market has experienced a moderate increase, with the Nikkei 225 index increasing by 1.0% in the last 24 hours.
💥COT Data
Speculators (Non-Commercials): 80,000 long positions and 120,000 short positions.
Hedgers (Commercials): 120,000 long positions and 80,000 short positions.
💥Intermarket Analysis
Correlation with USD: GBP/JPY has a positive correlation with USD/JPY, indicating that a strong dollar could boost GBP/JPY prices.
Correlation with Stocks: GBP/JPY has a low correlation with stocks, indicating that GBP/JPY could be a good hedge against stock market volatility.
💥Quantitative Analysis
Moving Averages: The 50-day moving average is at 185.000, and the 200-day moving average is at 180.000.
Relative Strength Index (RSI): The RSI is at 60, indicating a bullish market sentiment.
💥Market Sentiment Analysis
The overall sentiment for GBP/JPY is bullish, with a mix of positive and neutral predictions.
58% of client accounts are long on this market, indicating a bullish sentiment.
💥Positioning
The long/short ratio for GBP/JPY is currently 1.4.
The open interest for GBP/JPY is approximately 200,000 contracts.
💥Next Trend Move
Bullish Prediction: Some analysts predict a potential bullish move, targeting 195.000 and 200.000, due to the interest rate differential and the weak yen.
Bearish Prediction: Others predict a potential bearish move, targeting 185.000 and 180.000, due to the ongoing Brexit uncertainty and the strong pound.
💥Real-Time Market Feed
As of the current time, GBP/JPY is trading at 191.000, with a 1.2% increase in the last 24 hours.
💥Future Prediction
Short-Term: Bullish: 192.000-195.000, Bearish: 188.000-185.000
Medium-Term: Bullish: 200.000-205.000, Bearish: 180.000-175.000
Long-Term: Bullish: 210.000-220.000, Bearish: 160.000-150.000
💥Overall Summary Outlook
The overall outlook for GBP/JPY is bullish, with a mix of positive and neutral predictions.
The market is expected to experience a moderate increase, with some analysts predicting a potential bullish move targeting 195.000 - 200.000.
📌Keep in mind that these factors can change rapidly, and it's essential to stay up-to-date with market developments and adjust your analysis accordingly.
⚠️Trading Alert : News Releases and Position Management 📰 🗞️ 🚫🚏
As a reminder, news releases can have a significant impact on market prices and volatility. To minimize potential losses and protect your running positions,
we recommend the following:
Avoid taking new trades during news releases
Use trailing stop-loss orders to protect your running positions and lock in profits
💖Supporting our robbery plan 💥Hit the Boost Button💥 will enable us to effortlessly make and steal money 💰💵. Boost the strength of our robbery team. Every day in this market make money with ease by using the Thief Trading Style.🏆💪🤝❤️🎉🚀
I'll see you soon with another heist plan, so stay tuned 🤑🐱👤🤗🤩

GBP/JPY "The Guppy" Forex Market Bullish Heist Plan🌟Hi! Hola! Ola! Bonjour! Hallo! Marhaba!🌟
Dear Money Makers & Thieves, 🤑 💰🐱👤🐱🏍
Based on 🔥Thief Trading style technical and fundamental analysis🔥, here is our master plan to heist the GBP/JPY "The Guppy" Forex market. Please adhere to the strategy I've outlined in the chart, which emphasizes long entry. Our aim is the high-risk Red Zone. Risky level, overbought market, consolidation, trend reversal, trap at the level where traders and bearish robbers are stronger. 🏆💸Book Profits wealthy and safe trade.💪🏆🎉
Entry 📈 : "The heist is on! Buy above (193.000) then make your move - Bullish profits await!"
however I advise placing Place Buy limit orders within a 15 or 30 minute timeframe. Entry from the most recent or closest low or high level should be in retest.
Stop Loss 🛑:
Thief SL placed at the recent / nearest low level Using the 2H timeframe (190.000) swing trade basis.
SL is based on your risk of the trade, lot size and how many multiple orders you have to take.
Target 🎯:
1st Target - 197.000 (or) Escape Before the Target
Final Target - 202.000 (or) Escape Before the Target
🧲Scalpers, take note 👀 : only scalp on the Long side. If you have a lot of money, you can go straight away; if not, you can join swing traders and carry out the robbery plan. Use trailing SL to safeguard your money 💰.
📰🗞️Fundamental, Macro, COT, Sentimental Outlook:
🎇GBP/JPY "The Guppy" Forex Market is currently experiencing a bullish trend,., driven by several key factors.
⭐Market Overview
Current Price: 191.300
30-Day High: 195.500
30-Day Low: 185.000
30-Day Average: 190.000
Previous Close Price: 191.000
Change: 0.300
Percent Change: 0.16%
⭐Fundamental Analysis
Economic Indicators: The UK's GDP growth rate is expected to slow down to 1.4% in 2025, while Japan's GDP growth rate is expected to remain steady at 1.2%.
Monetary Policy: The Bank of England is expected to maintain its interest rates at 0.1% in 2025, while the Bank of Japan is expected to maintain its interest rates at -0.1%.
Trade Balance: The UK's trade balance is expected to remain in deficit, while Japan's trade balance is expected to remain in surplus.
Inflation Rate: The UK's inflation rate is expected to rise to 2.5% in 2025, while Japan's inflation rate is expected to remain steady at 1.5%.
⭐Macro Economics
Global Economic Trends: The ongoing global economic recovery is expected to drive up demand for the GBP, driven by increasing investor confidence.
Inflation Rate: Global inflation is expected to rise to 3.8% in 2025, potentially increasing demand for the GBP as a hedge against inflation.
Interest Rates: Central banks are expected to maintain low interest rates in 2025, potentially increasing demand for the GBP.
Commodity Prices: Commodity prices are expected to rise by 5% in 2025, driven by increasing demand for raw materials.
⭐COT Data
Non-Commercial Traders (Institutional):
Net Long Positions: 55%
Open Interest: 100,000 contracts
Commercial Traders (Companies):
Net Short Positions: 35%
Open Interest: 50,000 contracts
Non-Reportable Traders (Small Traders):
Net Long Positions: 10%
Open Interest: 10,000 contracts
COT Ratio: 1.6 (indicating a bullish trend)
⭐Sentimental Outlook
Institutional Sentiment: 60% bullish, 40% bearish.
Retail Sentiment: 55% bullish, 45% bearish.
Market Mood: The overall market mood is bullish, with a sentiment score of +40.
⭐Technical Analysis
Trend: The GBP/JPY pair is experiencing a strong downtrend, with the market respecting the 20-period Weighted Moving Average (WMA) as dynamic resistance
Key Levels: Support Zone: 187.500 - 187.334, Resistance Zones: 188.414 & 190.021 - 190.313
Target: 189.87, with a potential further decline to 186.2
⭐Next Move Prediction
Bullish Move: Potential upside to 195.000-197.000.
Target: 197.000 (primary target), 202.000 (secondary target)
Next Swing Target: 202.000 (potential swing high)
Stop Loss: 185.000 (below the 30-day low)
Risk-Reward Ratio: 1:2 (potential profit of 5.700 vs potential loss of 2.850)
⭐Future Data Summary
1-Day: -0.03%
5-Days: 0.80%
1-Month: 0.68%
6-Months: 0.55%
Year-to-Date: -2.84%
1-Year: 1.04%
5-Years: 33.90%
⭐Overall Outlook
The overall outlook for GBP/JPY is bullish, driven by a combination of fundamental, technical, and sentimental factors. The expected increase in global economic growth, growing demand for the GBP, and bullish market sentiment are all supporting the bullish trend. However, investors should remain cautious of potential downside risks, including changes in global economic trends and unexpected regulatory developments.
⚠️Trading Alert : News Releases and Position Management 📰 🗞️ 🚫🚏
As a reminder, news releases can have a significant impact on market prices and volatility. To minimize potential losses and protect your running positions,
we recommend the following:
Avoid taking new trades during news releases
Use trailing stop-loss orders to protect your running positions and lock in profits
📌Please note that this is a general analysis and not personalized investment advice. It's essential to consider your own risk tolerance and market analysis before making any investment decisions.
📌Keep in mind that these factors can change rapidly, and it's essential to stay up-to-date with market developments and adjust your analysis accordingly.
💖Supporting our robbery plan will enable us to effortlessly make and steal money 💰💵 Tell your friends, Colleagues and family to follow, like, and share. Boost the strength of our robbery team. Every day in this market make money with ease by using the Thief Trading Style.🏆💪🤝❤️🎉🚀
I'll see you soon with another heist plan, so stay tuned 🤑🐱👤🤗🤩

GBPJPY AnalysisGBPJPY Analysis and Trade Setup
GBP/JPY is currently testing a historically significant resistance level that has repeatedly acted as a barrier to price advancement. Given the strength of this resistance zone, it is reasonable to anticipate a potential rejection or pullback. Historically, such levels often prompt a reversal, particularly after a retest of the structure, which could further confirm the resistance's validity.
The likelihood of a rejection at this level is supported by the principles of technical analysis, as repeated tests of a resistance level tend to reinforce its significance.
In summary, while the current setup suggests a potential pullback from the resistance level, traders should remain cautious and monitor key technical and fundamental factors,

GBPJPY Buy signal on a 5-month bottom.The GBPJPY pair has been trading within a Channel Up since the August 05 2024 bottom and yesterday it made a Higher Low at the bottom of the pattern. This has been a buy opportunity 2/2 times and based on the similarities with the September 11 2024 Low, we can expect the new Bullish Leg to start and peak on the 1.5 Fibonacci extension. Our Target is 204.000.
-------------------------------------------------------------------------------
** Please LIKE 👍, FOLLOW ✅, SHARE 🙌 and COMMENT ✍ if you enjoy this idea! Also share your ideas and charts in the comments section below! This is best way to keep it relevant, support us, keep the content here free and allow the idea to reach as many people as possible. **
-------------------------------------------------------------------------------
💸💸💸💸💸💸
👇 👇 👇 👇 👇 👇
