Forget USDJPY: Time to watch GBPJPY for intervention? The UK’s inflation rate due this week (early early Wednesday morning), and there is a huge projected drop in the reading from last month, from 6.7% to 4.8%. This huge drop leaves a lot of room for disappointment, and higher CPI reading could exert upside pressure on the GBPJPY, which is already at a multi-month high. It is for this reason I bring up the possibility that traders should watch for intervention in this pair, whether direct or indirect.
Supporting the possibility of a bullish GBPJPY is the rejection of yesterday's significant downside wick (touching the 50-day moving average on the 1-hour chart). This rejection was followed by a further move to the upside.
Further upside will see the pair challenge the three-month high at 186.77 and open the possibility for a correction/ intervention. In the past, ¥185.00 has proven to be somewhat of an anchor point for the pair, but perhaps a more accurate support is now ¥185.50?
Don’t forget that US CPI numbers are due this week too, one day before UK numbers hit the market.
Gbpjpysignals

GBPJPY Top-down analysis Hello traders, this is a complete multiple timeframe analysis of this pair. We see could find significant trading opportunities as per analysis upon price action confirmation we may take this trade. Smash the like button if you find value in this analysis and drop a comment if you have any questions or let me know which pair to cover in my next analysis.

GBPJPY Head and Shoulders sell signalThe GBPJPY pair gave us a nice low risk sell trade last time we looked at it (see chart below):
This time it gives an even stronger one as it is on the 1W time-frame in the midst of a Head and Shoulders (H&S) formation. That is a bearish pattern calling for a a test of Support at 176.500. Most likely by the time of the test, the 1W MA50 (blue trend-line) will be very close to provide the first level of long-term Support.
Notice that the 1W RSI is on Channel Down pattern similar to the April - August 2021 H&S and so does the 1W MACD which is coming off a Bearish Cross. That pattern eventually hit its Support once completed.
-------------------------------------------------------------------------------
** Please LIKE 👍, FOLLOW ✅, SHARE 🙌 and COMMENT ✍ if you enjoy this idea! Also share your ideas and charts in the comments section below! This is best way to keep it relevant, support us, keep the content here free and allow the idea to reach as many people as possible. **
-------------------------------------------------------------------------------
💸💸💸💸💸💸
👇 👇 👇 👇 👇 👇

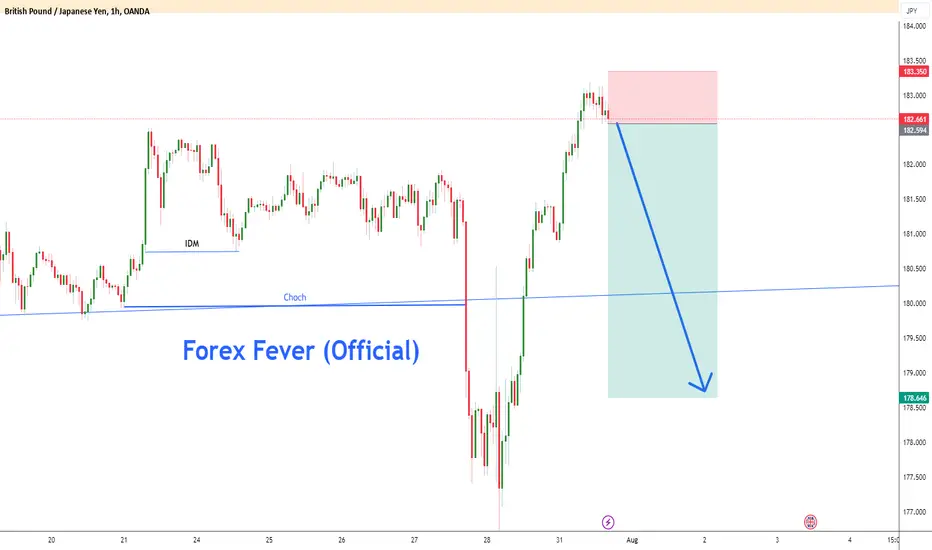
GbpJpy- Drop ofter confluence resistance test?In my previous analysis on GbpJpy, I said that the pair could rise and test confluence resistance at around 183.
Friday's close found the pair exactly in that level and after the gap from Monday's open, the pair continued down.
At this moment the pair is trading in the support given by the recent ascending trend line and a break above this level is probable.
In such an instance, continuation is probable and the paint could reach the previous low.
I'm bearish as long as the price stays under 183

GBPJPY Top-down analysis Hello traders, this is a complete multiple timeframe analysis of this pair. We see could find significant trading opportunities as per analysis upon price action confirmation we may take this trade. Smash the like button if you find value in this analysis and drop a comment if you have any questions or let me know which pair to cover in my next analysis.

GBPJPY Day trading setup!Hello traders, this is a complete multiple timeframe analysis of this pair. We see could find significant trading opportunities as per analysis upon price action confirmation we may take this trade. Smash the like button if you find value in this analysis and drop a comment if you have any questions or let me know which pair to cover in my next analysis.

GBPJPY Top-down analysis Hello traders, this is a complete multiple timeframe analysis of this pair. We see could find significant trading opportunities as per analysis upon price action confirmation we may take this trade. Smash the like button if you find value in this analysis and drop a comment if you have any questions or let me know which pair to cover in my next analysis.

GBPJPY Top-down analysis Hello traders, this is a complete multiple timeframe analysis of this pair. We see could find significant trading opportunities as per analysis upon price action confirmation we may take this trade. Smash the like button if you find value in this analysis and drop a comment if you have any questions or let me know which pair to cover in my next analysis

GbpJpy- More than 500 pips selling opportunity2023 was a very strong year for GbpJpy, with the pair rising more than 3k pips, exceeding my target of 180 as explained in both my 17th of January 2022 and 20th of April 2022 long-term analysis.
Although the pair remains in an up trend, for a month now, GbpJpy has failed on 186, unable to make a new high, leaving long up-tailed weekly candles.
This suggests that a top could be in place and a much-needed correction could follow.
With this in mind, I will look to sell rallies for a medium-term trade with a 500 pips target.
A new high would negate my outlook.
My previous long-term analyses for GbpJpy:

GBPJPY Sell signal on this Triangle pattern.The GBPJPY pair is trading within a Triangle pattern, similar to July's. The price is currently approaching the 4H MA200 (orange trend-line), which is untouched since August 08. As long as the pair closes below the 0.382 Fibonacci level, we are selling the bearish break-out and target 181.600 (Fibonacci 1.5). Notice how the 4H MACD sequences between the two fractals are identical.
-------------------------------------------------------------------------------
** Please LIKE 👍, FOLLOW ✅, SHARE 🙌 and COMMENT ✍ if you enjoy this idea! Also share your ideas and charts in the comments section below! **
-------------------------------------------------------------------------------
💸💸💸💸💸💸
👇 👇 👇 👇 👇 👇

GBPJPY Top-down analysisHello traders, this is a complete multiple timeframe analysis of this pair. We see could find significant trading opportunities as per analysis upon price action confirmation we may take this trade. Smash the like button if you find value in this analysis and drop a comment if you have any questions or let me know which pair to cover in my next analysis.

GBPJPY Top-down analysis Hello traders, this is a complete multiple timeframe analysis of this pair. We see could find significant trading opportunities as per analysis upon price action confirmation we may take this trade. Smash the like button if you find value in this analysis and drop a comment if you have any questions or let me know which pair to cover in my next analysis.

GBPJPY, Expecting Down, updatedGBPJPY, i am expecting a down move because there is brearish formula candle on the top of the market which is also an resistance area + RSI level is also around 75 level, so expecting a short but consistent move.
GBPJPY, H1 Expecting Strong SellGBPJPY, i am expecting a strong sell from recent price and if this fail, then i am expecting strong sell entry from 182.00 area.

GBPJPY - SHORT; Looking for a Top hereThe Pound found itself rather unimpressed on the heels of the recent inflation data prints. Speculation abound whether there is one more rate hike left in the BoE, before long? (Likely.) Even so, everything (including the kitchen sink) has already been factored into the Pound crosses thus, any short fall in inflation prints from here on out are likely to have severe (down side) consequences! This pair has been quite overextended, already, above 170.00.
The EUR/GBP is showing signs of an intermediate bottom, following its recent drop. (Thus, if anything this is the pair to look for Shorts, vs. the EURJPY.)
Overall, both pairs EUR/JPY and this one, GBP/JPY are somewhere very close to a (very!) long term top, e.g., both pairs are deserving some unmitigated attention at this point.
Looking for Short Entries here
Here is the Daily view;
... and here is the EURGBP;

GBPJPY Trade PlanGBPJPY testing the major support again and hopefully we can see rejection from the support zone.
Manage your risk according to account size.

GBPJPY ABCD PatternBullish AB=CD pattern is formed on currency pair GBPJPY and now the trend will be reverseded from D to bullish. Manage your levels accordingly.

GBPJPY Next Possible MovePair : GBPJPY ( British Pound / Japanese Yen )
Description :
Rising Wedge as an Correction in Long Time Frame
Impulse Correction
HH - HL
Divergence
Break of Structure
Bullish Channel in Short Time Frame

GBPJPY Top-down analysis Hello traders, this is a complete multiple timeframe analysis of this pair. We see could find significant trading opportunities as per analysis upon price action confirmation we may take this trade. Smash the like button if you find value in this analysis and drop a comment if you have any questions or let me know which pair to cover in my next analysis.

GBPJPY approaching the most optimal sell level.The GBPJPY pair is approaching the Inner Higher Highs trend-line that is in effect for more than a year (since April 20 2022) on a similar Channel Up (green) like the ones of October 2022 and March - April 2022. The 1D RSI is almost overbought, and the 1D MA50 (blue trend-line) has been supporting since March 28. We are starting a sell sequence with the 1D MA200 (orange trend-line) as our medium-term target with a projected contact at 166.500. Notice how common it is for the pair to peak when the 1D RSI double tops.
-------------------------------------------------------------------------------
** Please LIKE 👍, FOLLOW ✅, SHARE 🙌 and COMMENT ✍ if you enjoy this idea! Also share your ideas and charts in the comments section below! **
-------------------------------------------------------------------------------
💸💸💸💸💸💸
👇 👇 👇 👇 👇 👇

GBPJPY Top-down analysisHello traders, this is a complete multiple timeframe analysis of this pair. We see could find significant trading opportunities as per analysis upon price action confirmation we may take this trade. Smash the like button if you find value in this analysis and drop a comment if you have any questions or let me know which pair to cover in my next analysis.

GBPJPY Top-down analysisHello traders, this is a complete multiple timeframe analysis of this pair. We see could find significant trading opportunities as per analysis upon price action confirmation we may take this trade. Smash the like button if you find value in this analysis and drop a comment if you have any questions or let me know which pair to cover in my next analysis.

GBPJPY top-down analysis Hello traders, this is a complete multiple timeframe analysis of this pair. We see could find significant trading opportunities as per analysis upon price action confirmation we may take this trade. Smash the like button if you find value in this analysis and drop a comment if you have any questions or let me know which pair to cover in my next analysis.
