Gbpjpytrade

GBP/JPY Wait For RetraceThe previous trade I posted on this pair went very well and hit TP. This is now at a large resistance level and has been overbought so I want to see a retrace before taking another position. RSI is showing overbought on daily and weekly timeframes. There is a chance to open a short trade but I will not be taking that trade personally as I do not like trading against the trend.
This could retrace to any of the Fibonacci levels before rebounding but it is worth keeping a close eye on 0.382 Fib as this aligns perfectly with previous structure. If there is a clear reaction to that price level then that may be a good price to long from.
TP can be set at the previous high of 148.296 for a safer trade, as I said this is at big resistance so setting a TP above is risky. If you are willing to take that risk the net target can be 151.666

GBPJPY POSSIBLE SHORT AFTER LIQUIDITY GRABPossible opportunity to go short on GBPJPY, if it shows breaks of structure after reaching 147.741 area or the weekly and monthly highs of 147.785 for a liquidity grab.

GBPJPY Gonna Create Bearish Butterfly GJ Gonna short from 148.7xx Range.
1st TP 146.75
2nd TP 142.85
3RD TP 140.70

Pound/Yen Longs activated - 16Feb2021Please check the chart for the analysis and trade breakdown. Do comment on it with your views.

GBP/JPY Pushing Past ResistanceLooking like weakness in JPY and strength in GBP at the moment which combined should push this higher. We are currently at resistance and price is looking bullish so i expect this to push on. MACD and EMA's suggest this is only going up. Targeting the previous high of 147.961. SL just below support.

GBPJPY Short (Sell) Trade SetupThis is a short term setup as we've got divergence on the RSI and rejection of a key level. We may drop to the green zones for a potential long entry.


GBPJPY UPDATESell limits on aggressive entry was triggered. Updated my TP for a new buy limit in place. Looking for new lows and highs next week.
CHECK OUT 2021 SIGNAL TRADE JOURNAL FOR INVEST BEYOND.
docs.google.com

GBPJPY Short (Sell) Trade Daily SetupSimilar to GBPUSD, this pair is making it's way closer to a strong sell zone. In fact, there are two sell zones in close proximity. On lower time frames (2H + 4H) we can see price has been slowing down, accumulating buy orders and pushing up towards these key levels.
From the two supply zones, the lower one is weaker and both are untested.
Keep an eye on price action on lower time frames for any indications of a potential change in trend. We may not drop, we could fall into a range first, in which case, I will update with further charts.

SELL TRADE ON GBPJPY THIS WEEK!!!! Currently seeing a switch in market flow and some exhaustion on the daily timeframe.
M15 is showing signs of transition with a break in the last HL and minor supply areas are being created. These areas are gonna be my key entry areas this week. lets see go it goes.

GBPJPY, Strong Resistance, ShortGBPJPY, has a Strong Resistance, Strong Trend line, and price action calls healthy pull back!

GBPJPY Short SetupWe have here another potential short setup on GBPJPY.
This research is for informational purposes and should not be construed as personal or financial advice. Trading any financial market involves risk. Trading on leverage involves risk of losses greater than deposits.
Long Position On GBPJPYLooking at a lot of analysis and also confirmation of multiple other traders is looking like a long position is available in the coming week.

GBPJPY Short SetupAs we wait for price to reach the demand zone for our buy setup, we can see we've double-topped the resistance level. This makes for a nice short entry.

GBPJPY 4HRThe bullish break of structure occurred around the 137.90 handle. It's currently retesting the 137.90 handle where it's safe to place a short sell to minimum 136.385 handle. It should complete the D leg structure of Harmonics at that level and from there it should wise to place a buy, however in order for the bulls to get a stronghold it should break 139.813 handle.


GBPJPY SELL So GBPJPY broke out of ASIAN SESSION high and i'm expecting it to continue to move to the downside for +120 as my final TP.


GBPJPY 800 Pips/8% Account growth expected will it reach 145.00?GBJPY
*********
⏳4 Hour chart
🎲 Possible entry analysis
⛳️ Possible bull/bear target
📚Educational
—————-❇️——————-
Detailed analysis 💬
1️⃣ Price above Point of control-Volume profile
2️⃣ Bounce from lower trendline
3️⃣ Broad weakness of USD, Positive brexit talks
4️⃣ 138.00 Dynamic support and resistance
5️⃣Bounce from 134.00 Key psychological level
6️⃣ 135.00 will Acted as strong support
7️⃣ Technical support - Bull
8️⃣141.500 will acted as key reversal-bearish
9️⃣ July high-Immediate resistance-Alternative bearish entry
🔟 Possible swing target-145.00 psychological level
#️⃣ Overall bullish trend-Within converging triangle pattern
—————-❇️——————-
📉 Technical bias-H4-Bullish
Price is around 50,100,200 Exponential moving average
100,200 Exponential moving average will act as support-Bull
Relative strength index - Reached 60- Still it has some room for the bull
MACD -Turned green and well above signal line, oscillators pointing upward
Stochastic - Reached 75- overbought condition short term fall back expected
Ichimoku cloud -cloud is still green-Price is above the cloud-Middle line support
Bollinger band- Price reached around the upper band-Short term bearish correction towards middle band
—————-✳️——————-
Key reversal area's
136.000 psychological level
142.600 August month high
139.730 July month high
136.050 50% Fibonacci retracement level
140.00 Major psychological level
136.400 Possible entry- Bull
141.500 Trendline resistance/Alternative bearish entry
—————-✳️——————-
Bullish entry #poundr #gbpjpy
Entry price - 136.400
Take profit 01 - 138.400 (180 PIPS)
Take profit 02 - 141.500 (475 PIPS)
Take profit 03 - 145.000 (800 PIPS)
🚫 Stop lose 135.400
⬆️ 6.3% Growth expected
⤴️ Account growth .73: 6.3
✅ Risk reward ratio 1 : 8.5
—————-⚜️——————-
Push the like button , And cheer up if you found useful

GJLooking for buys on pound yen..analyse first before making decisions..happy trading and be blessed..

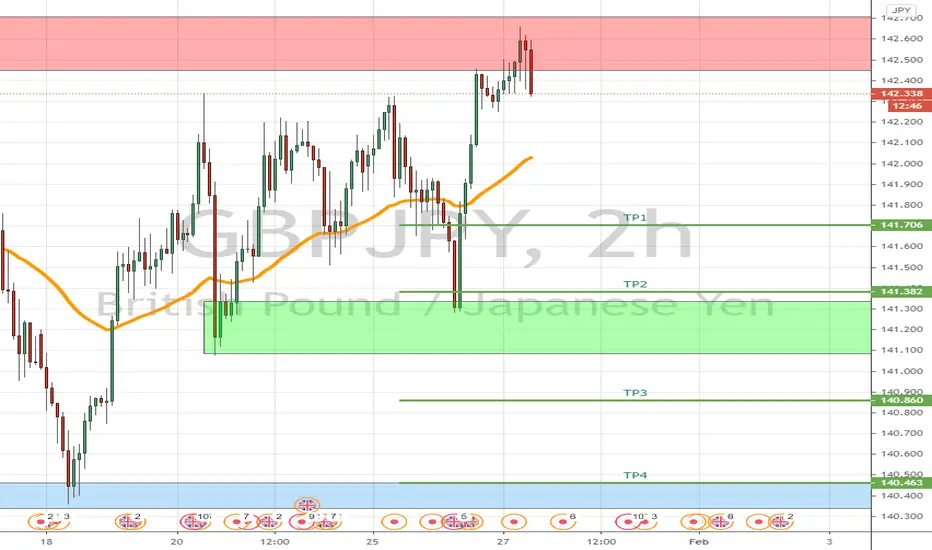
GBPJPY FORECAST UPDATE* Trade hits TP 1 about 100 pips / 1000 points *
I partially closed my positions, moved SL level to a better RR and let the rest run.
